Fig. 3.
Download original image
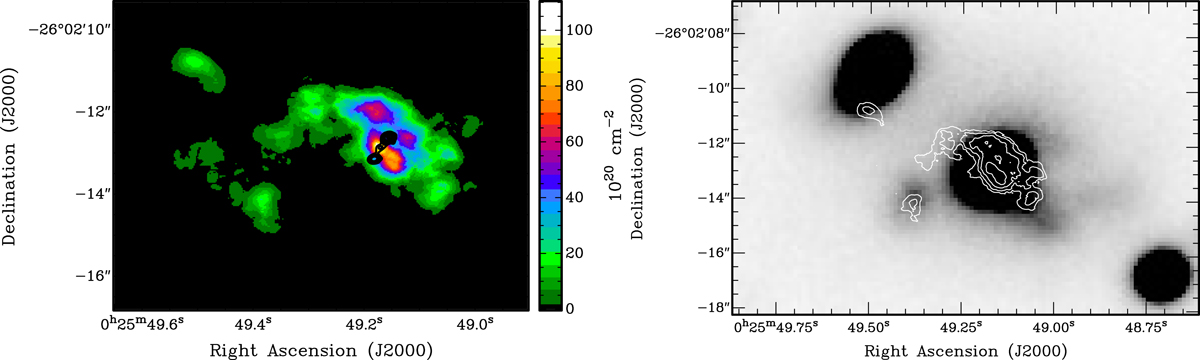
Left: column density image of the molecular gas with superimposed the contours of the continuum emission. The core of the radio emission is coincident with the peak of the molecular gas (see text for details). Contour levels are 1.3, 2.6, 5.2, 10.4, 20.8, and 41.6 mJy beam−1. The rms noise of the CO and continuum images can be found in Table 1. Right: column density contours of the molecular gas over-plotted to the optical image from Ramos Almeida et al. (2011). The offset of the molecular gas compared to the optical galaxy hosting PKS 0023−26 is clearly seen. The arm-like structure to the E points toward one of the close companions where CO emission is also detected. Contour levels are 10, 20, 50, 100, 200, and 500 × 1020 cm−2.
Current usage metrics show cumulative count of Article Views (full-text article views including HTML views, PDF and ePub downloads, according to the available data) and Abstracts Views on Vision4Press platform.
Data correspond to usage on the plateform after 2015. The current usage metrics is available 48-96 hours after online publication and is updated daily on week days.
Initial download of the metrics may take a while.