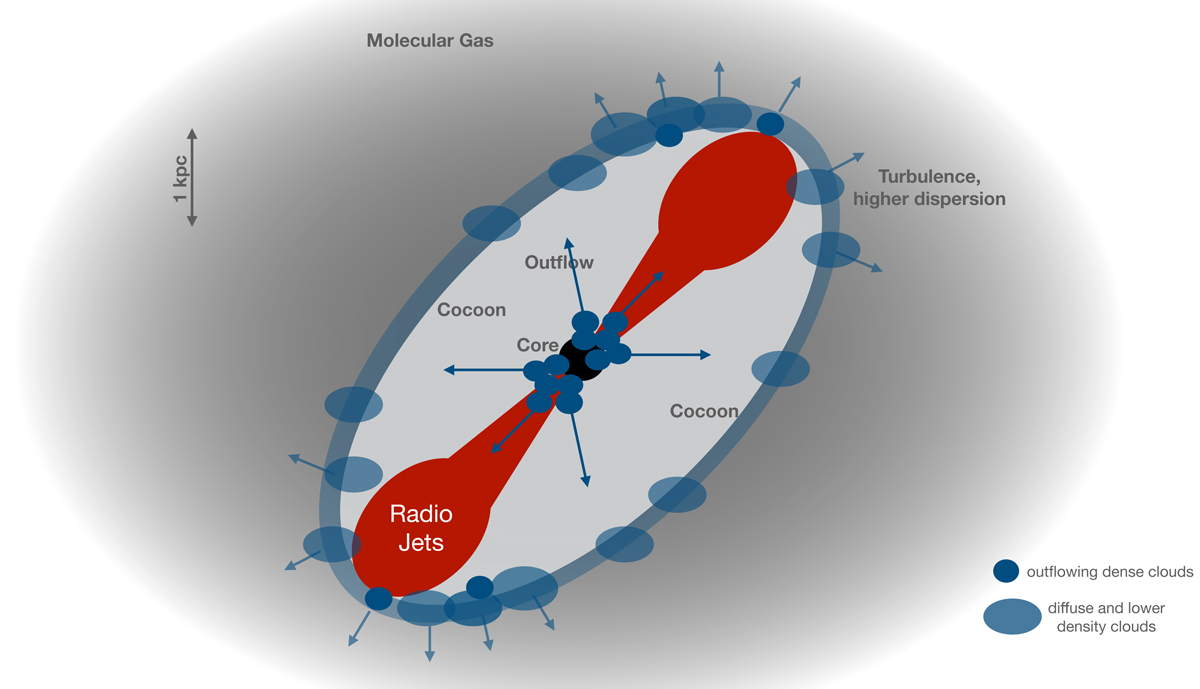
Fig. 11.
Download original image
Cartoon illustrating the proposed scenario (see text for details). The length of the arrows indicates the higher velocities of the molecular gas observed in the central (sub-kiloparsec) regions compared to the larger scales. The dark grey area indicate the low velocity dispersion gas, the light grey indicates the regions – along the radio axis – where a dearth of molecular gas is seen.
Current usage metrics show cumulative count of Article Views (full-text article views including HTML views, PDF and ePub downloads, according to the available data) and Abstracts Views on Vision4Press platform.
Data correspond to usage on the plateform after 2015. The current usage metrics is available 48-96 hours after online publication and is updated daily on week days.
Initial download of the metrics may take a while.