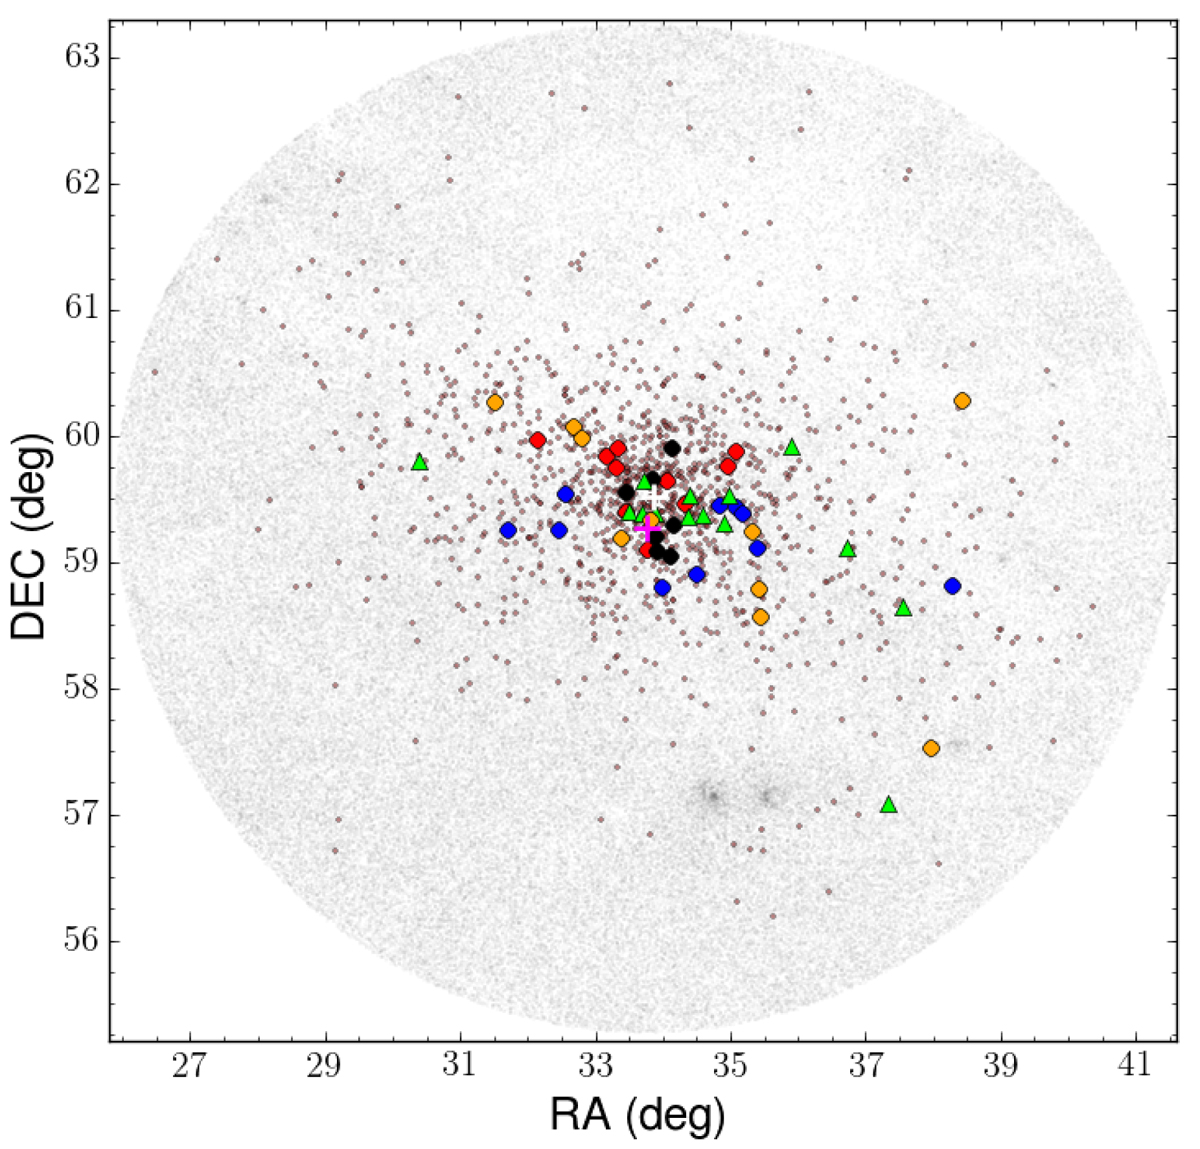
Fig. 3.
Download original image
Sky region around Stock 2. Grey dots show sources with G ≤ 16 mag within a radius of 240′ around the cluster nominal centre (magenta cross). Cluster members identified by Cantat-Gaudin et al. (2018) are represented by black points, and the cluster centre derived from them is shown by the white cross. Coloured circles and green triangles are the objects observed in this work (see Fig. 1) with the HARPS-N and CAOS spectrographs, respectively. The overdensities visible at RA ∼ 35° and Dec ∼ 57° correspond to the h & χ Per double cluster.
Current usage metrics show cumulative count of Article Views (full-text article views including HTML views, PDF and ePub downloads, according to the available data) and Abstracts Views on Vision4Press platform.
Data correspond to usage on the plateform after 2015. The current usage metrics is available 48-96 hours after online publication and is updated daily on week days.
Initial download of the metrics may take a while.