Free Access
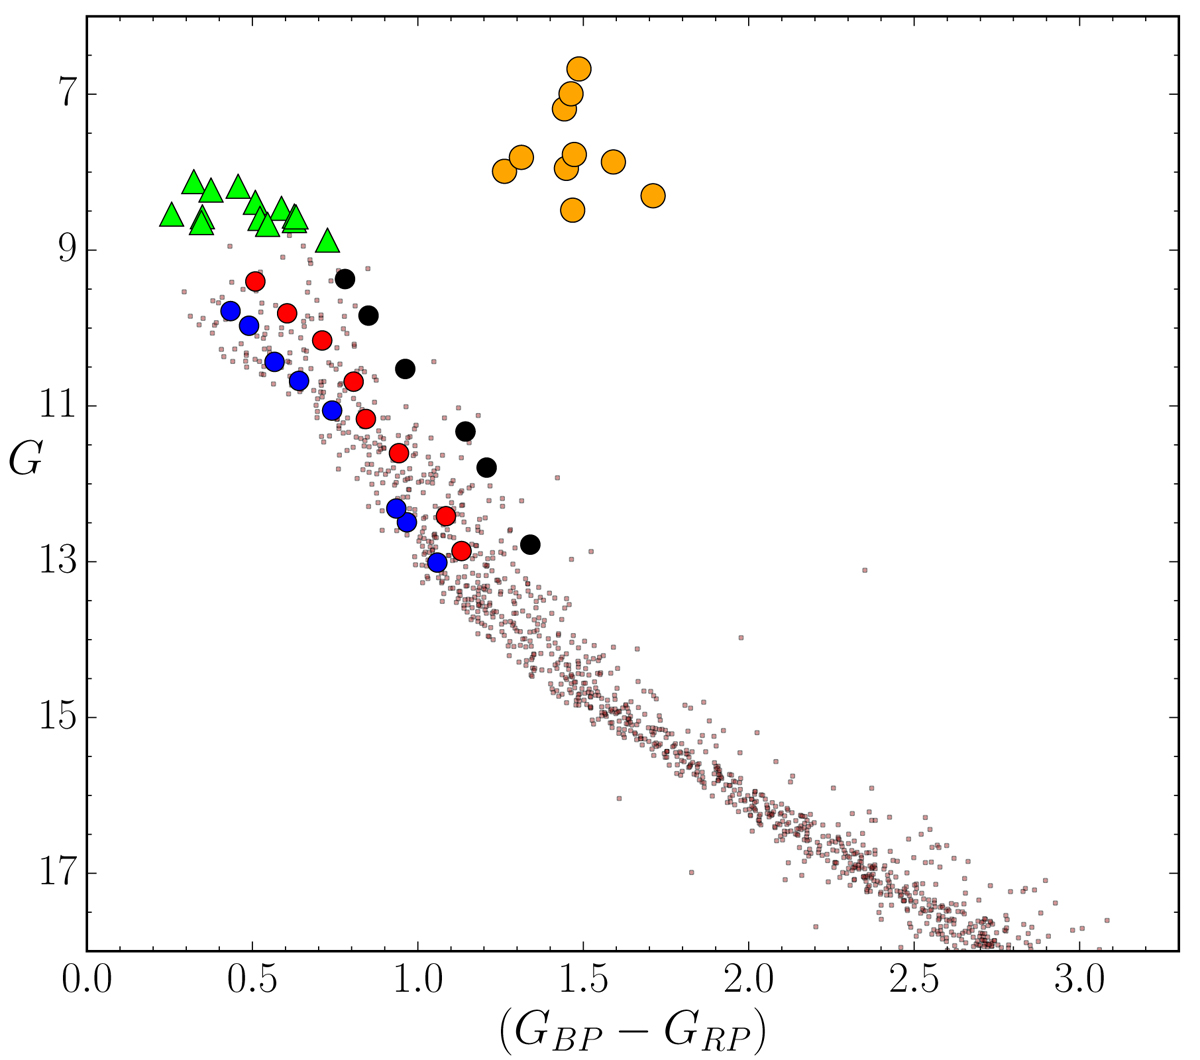
Fig. 1.
Download original image
G/(GBP − GRP) diagram for Stock 2. Members from Cantat-Gaudin et al. (2018) are marked with light brown dots. Stars observed with CAOS in this work are represented with green triangles while those observed with HARPS-N appear as circles with different colours, as explained in the text.
Current usage metrics show cumulative count of Article Views (full-text article views including HTML views, PDF and ePub downloads, according to the available data) and Abstracts Views on Vision4Press platform.
Data correspond to usage on the plateform after 2015. The current usage metrics is available 48-96 hours after online publication and is updated daily on week days.
Initial download of the metrics may take a while.