Fig. 9.
Download original image
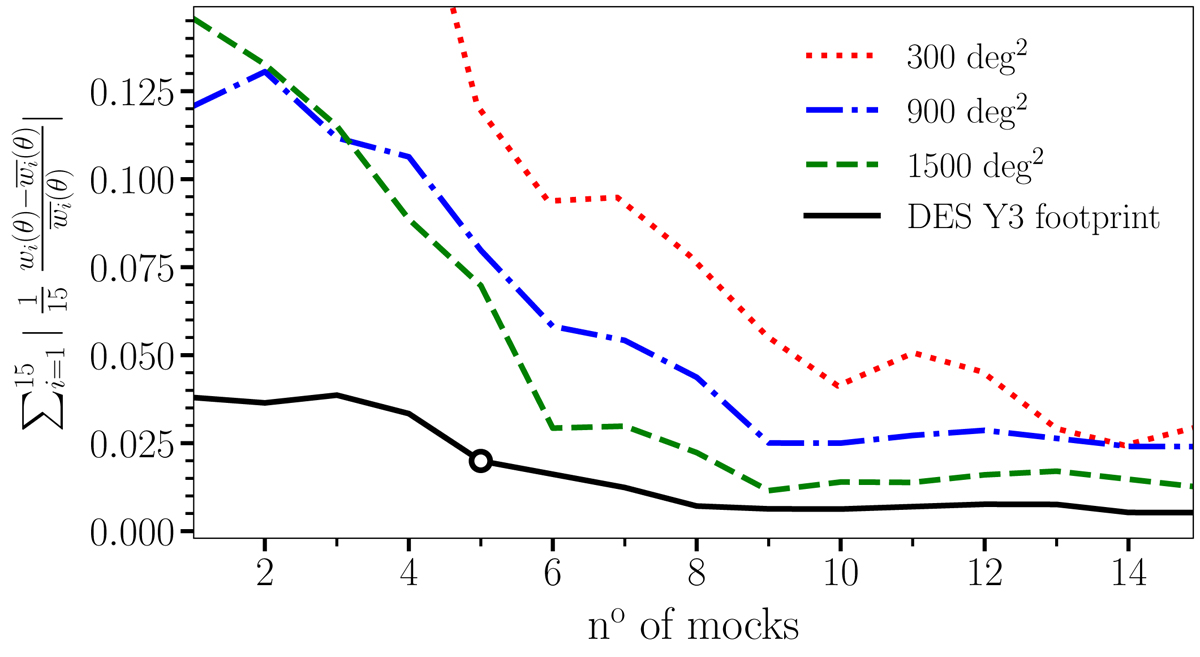
Agreement between w(θ) of a subset of mocks and the mean of w(θ) for all mocks as a function of the number of mocks used for the selection. The dotted red line stands for mocks of 300 deg2, while the dot-dashed blue line represents mocks of 900 deg2 and the dashed green one corresponds to mocks of 1500 deg2 The solid black line stands for mocks of 4108.47 deg2 with the mask of DES Y3 BAO data. The black open circle denotes the selection of the number of mocks and area used for the calibration in this analysis. The number 15 on the y-axis corresponds to the number of clustering measurements averaged (three angular apertures times five redshift bins).
Current usage metrics show cumulative count of Article Views (full-text article views including HTML views, PDF and ePub downloads, according to the available data) and Abstracts Views on Vision4Press platform.
Data correspond to usage on the plateform after 2015. The current usage metrics is available 48-96 hours after online publication and is updated daily on week days.
Initial download of the metrics may take a while.