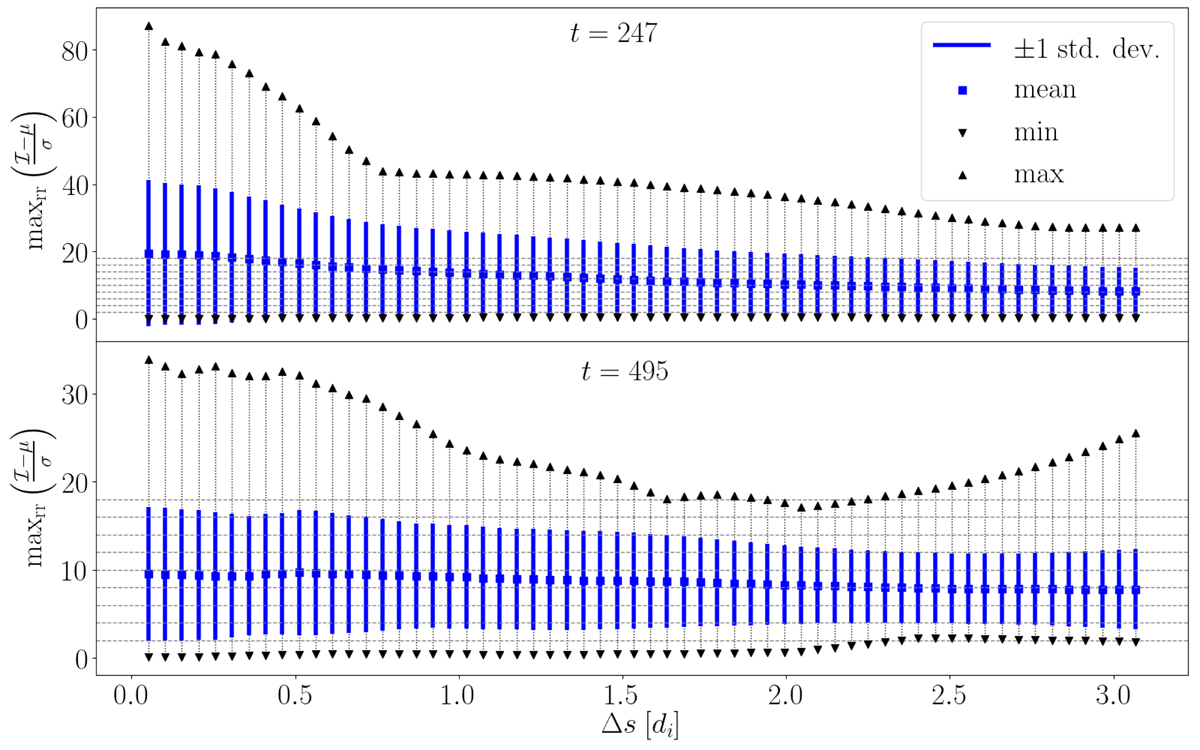
Fig. 7.
Download original image
Average of the PVI peak values related to the human-verified reconnection events (i.e., average of the PVI local maxima collected at each crossing of reconnection regions) for each lag Δs (blue squares). The ±1σ interval (blue vertical bars), the maximum values (upright black triangles), and the minimum values (upside-down black triangles) are also reported. Horizontal dashed lines are the thresholds used for Figs. 4–5. To compare PVI peak values from different trajectories, the standardized PVI (ℐ − μ(ℐ))/σ(ℐ) is reported (where μ(ℐ) = ⟨ℐ⟩). Top panel is for t = 247 and the bottom panel for t = 494.
Current usage metrics show cumulative count of Article Views (full-text article views including HTML views, PDF and ePub downloads, according to the available data) and Abstracts Views on Vision4Press platform.
Data correspond to usage on the plateform after 2015. The current usage metrics is available 48-96 hours after online publication and is updated daily on week days.
Initial download of the metrics may take a while.