Free Access
Fig. 6.
Download original image
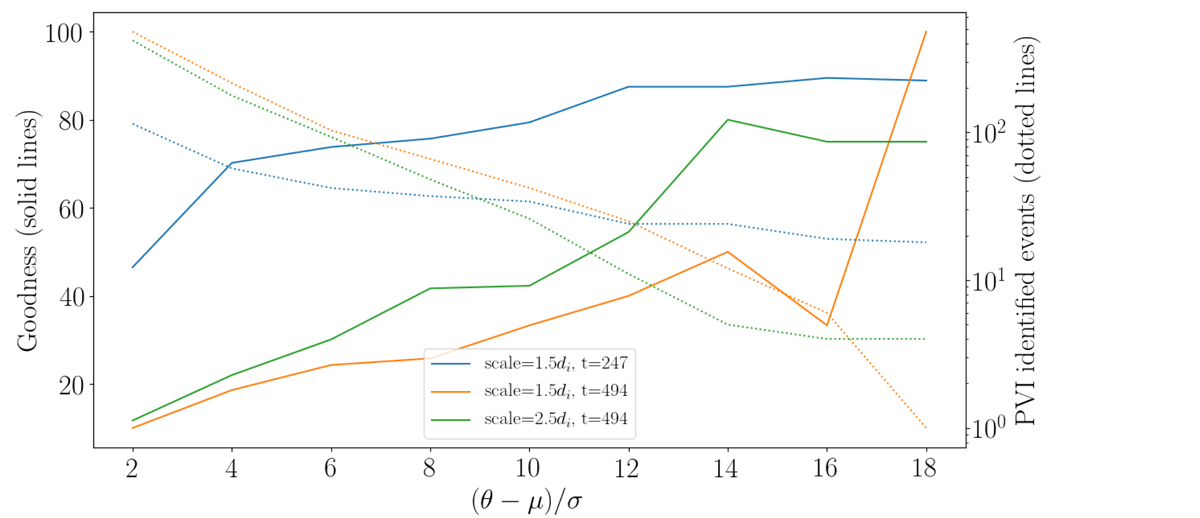
Solid lines: Variation of goodness as a function of threshold θ in three different cases: (1) Δs = 1.5di, t = 247; (2) Δs = 1.5di, t = 494; and (3) Δs = 2.5di, t = 494. Dotted lines: Number of PVI peaks above each threshold value for the same three cases (in matching colors).
Current usage metrics show cumulative count of Article Views (full-text article views including HTML views, PDF and ePub downloads, according to the available data) and Abstracts Views on Vision4Press platform.
Data correspond to usage on the plateform after 2015. The current usage metrics is available 48-96 hours after online publication and is updated daily on week days.
Initial download of the metrics may take a while.