Free Access
Fig. 1.
Download original image
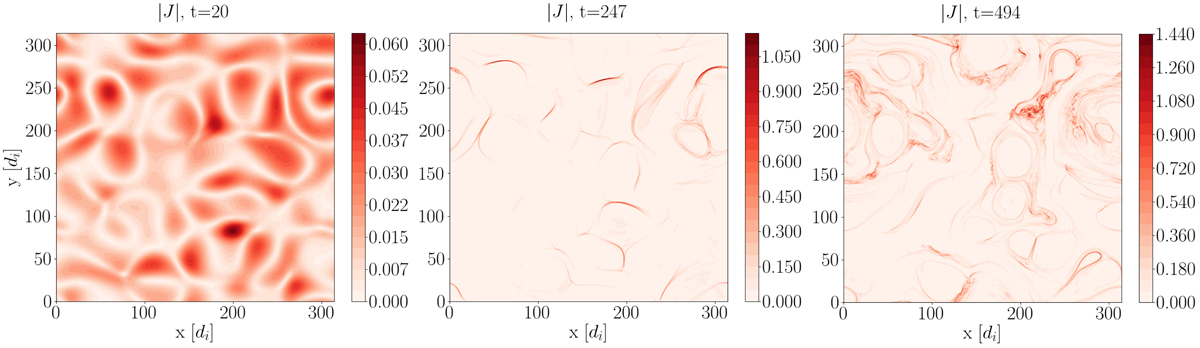
Distribution of the intensity of the current density within the x–y plane at three different simulation times (indicated at the top of the panels). The time t = 494 corresponds to a fully developed turbulent state, where a Kolmogorov-like spectrum at intermediate scales has developed (see Fig. 2).
Current usage metrics show cumulative count of Article Views (full-text article views including HTML views, PDF and ePub downloads, according to the available data) and Abstracts Views on Vision4Press platform.
Data correspond to usage on the plateform after 2015. The current usage metrics is available 48-96 hours after online publication and is updated daily on week days.
Initial download of the metrics may take a while.