Free Access
Fig. 3
Download original image
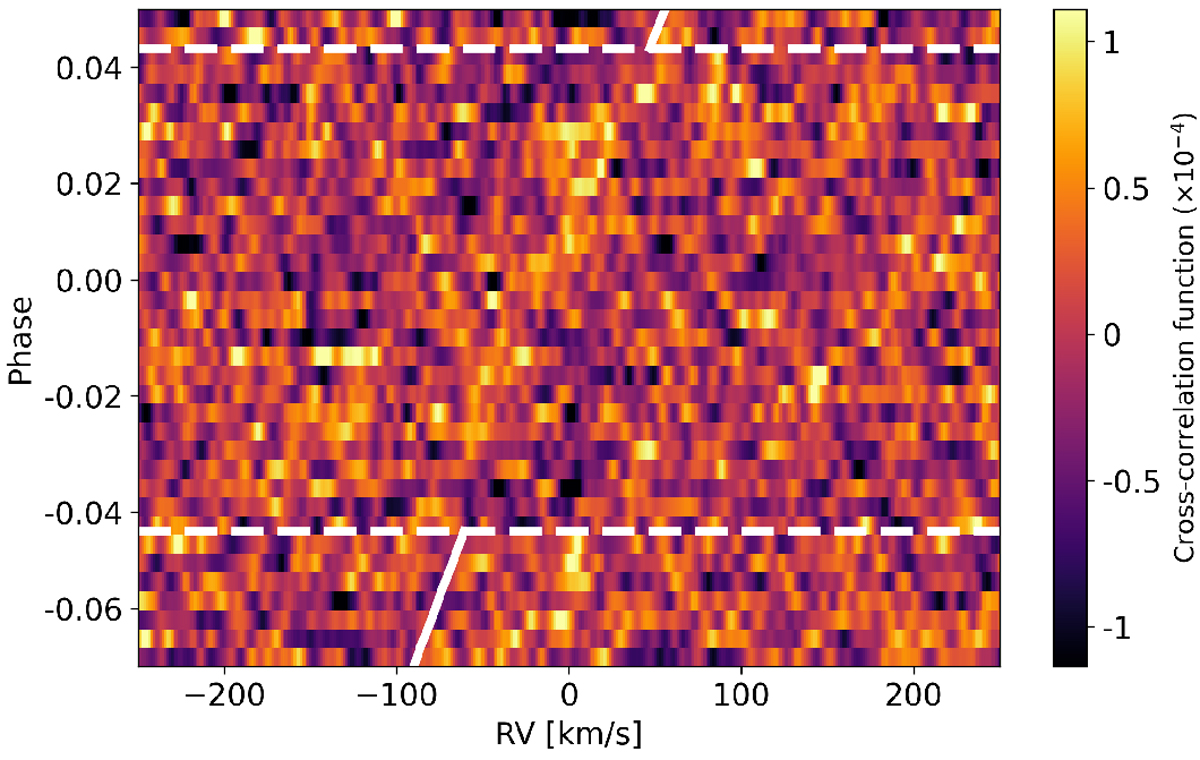
Resulting CCF for each of the spectra, with the RV in the Earth’s rest frame on the horizontal axis and the planet orbital phase on the vertical axis. The horizontal dashed white lines indicate the start and end of the transit, while the slanted vertical lines show the expected slope and location of the planetary signal.
Current usage metrics show cumulative count of Article Views (full-text article views including HTML views, PDF and ePub downloads, according to the available data) and Abstracts Views on Vision4Press platform.
Data correspond to usage on the plateform after 2015. The current usage metrics is available 48-96 hours after online publication and is updated daily on week days.
Initial download of the metrics may take a while.