Fig. 7
Download original image
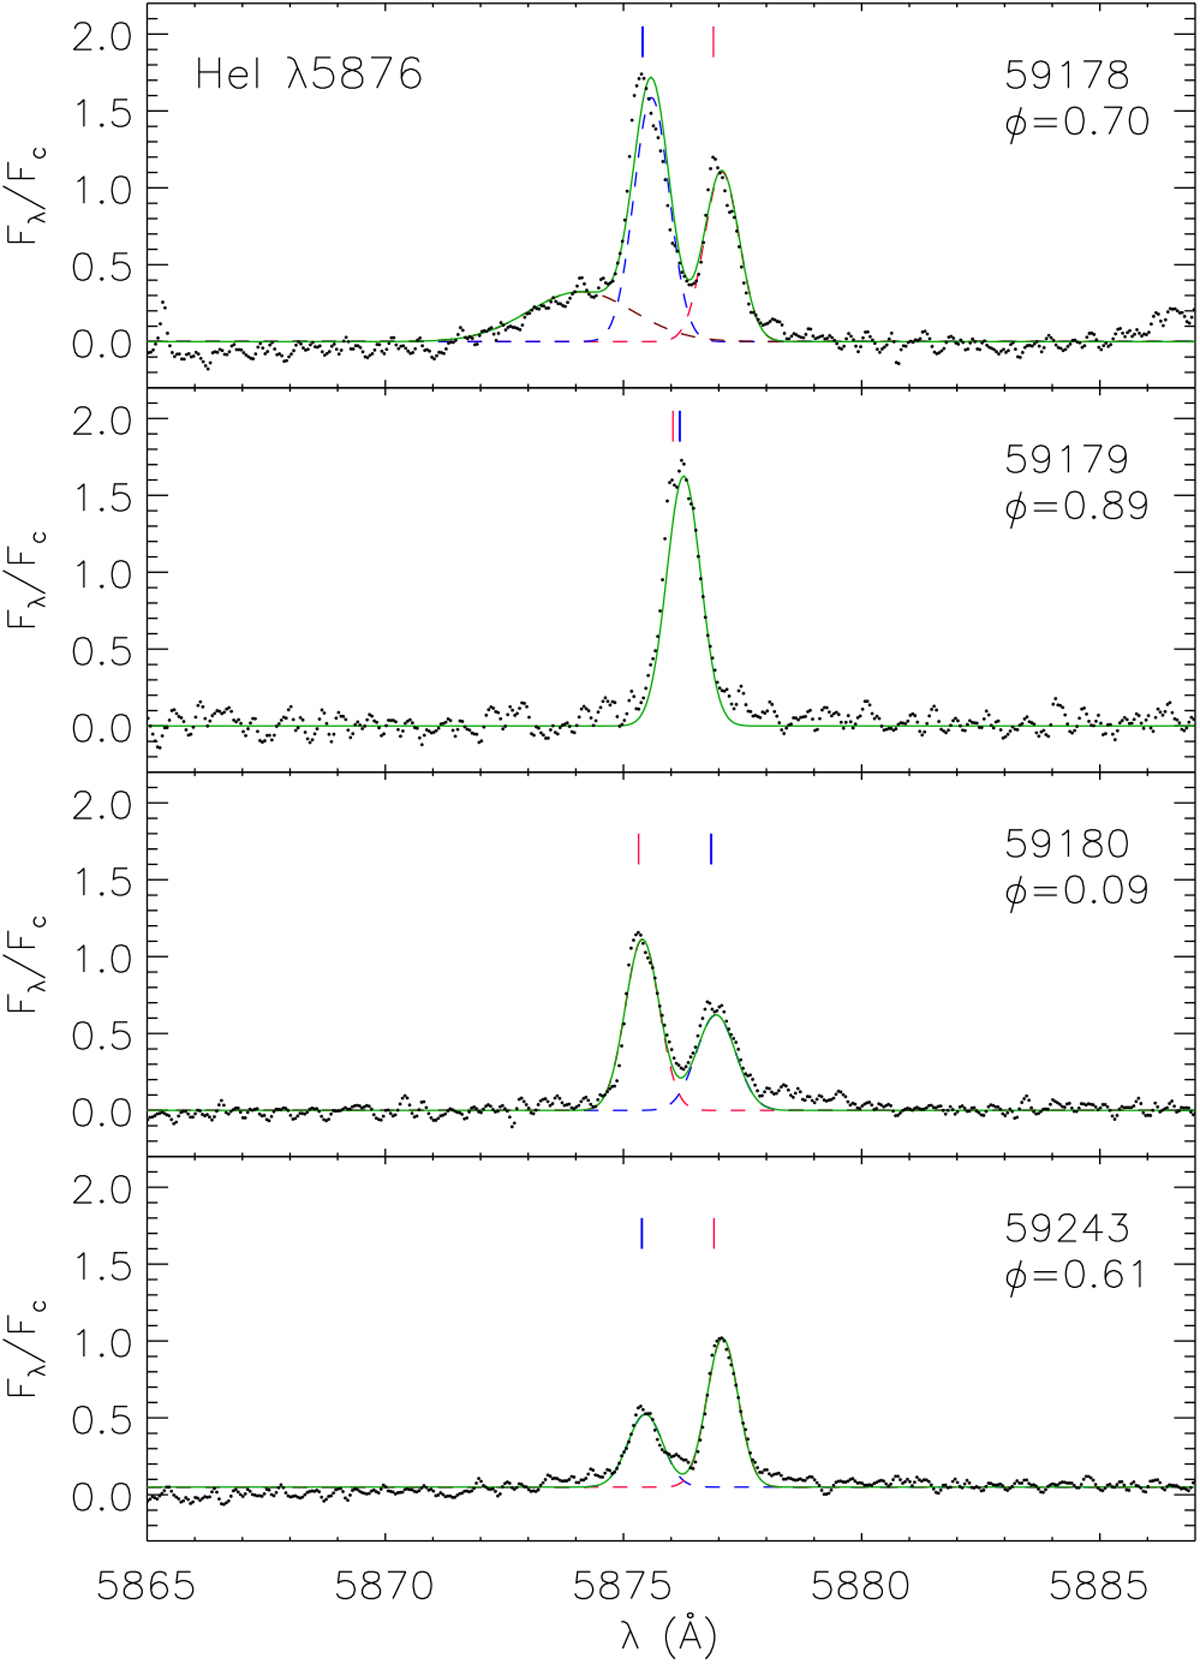
Residual UVES He Iλ5876 Å profiles (black dots). In each panel, the two-Gaussian fit to the emission peaks (green full line) and the individual Gaussians corresponding to the primary (blue dashed line) and secondary (red dashed line) component are overlaid. The blue and red vertical ticks mark the expected position of the lines of primary and secondary component, respectively, according to the photospheric RV. The dashed brown line in the upper panel represents the Gaussian fitted to the excess blueshifted emission observed only in this spectrum. The reduced Julian day and the orbital phase (ϕ) are marked in the upper right corner of each box.
Current usage metrics show cumulative count of Article Views (full-text article views including HTML views, PDF and ePub downloads, according to the available data) and Abstracts Views on Vision4Press platform.
Data correspond to usage on the plateform after 2015. The current usage metrics is available 48-96 hours after online publication and is updated daily on week days.
Initial download of the metrics may take a while.