Fig. A.4
Download original image
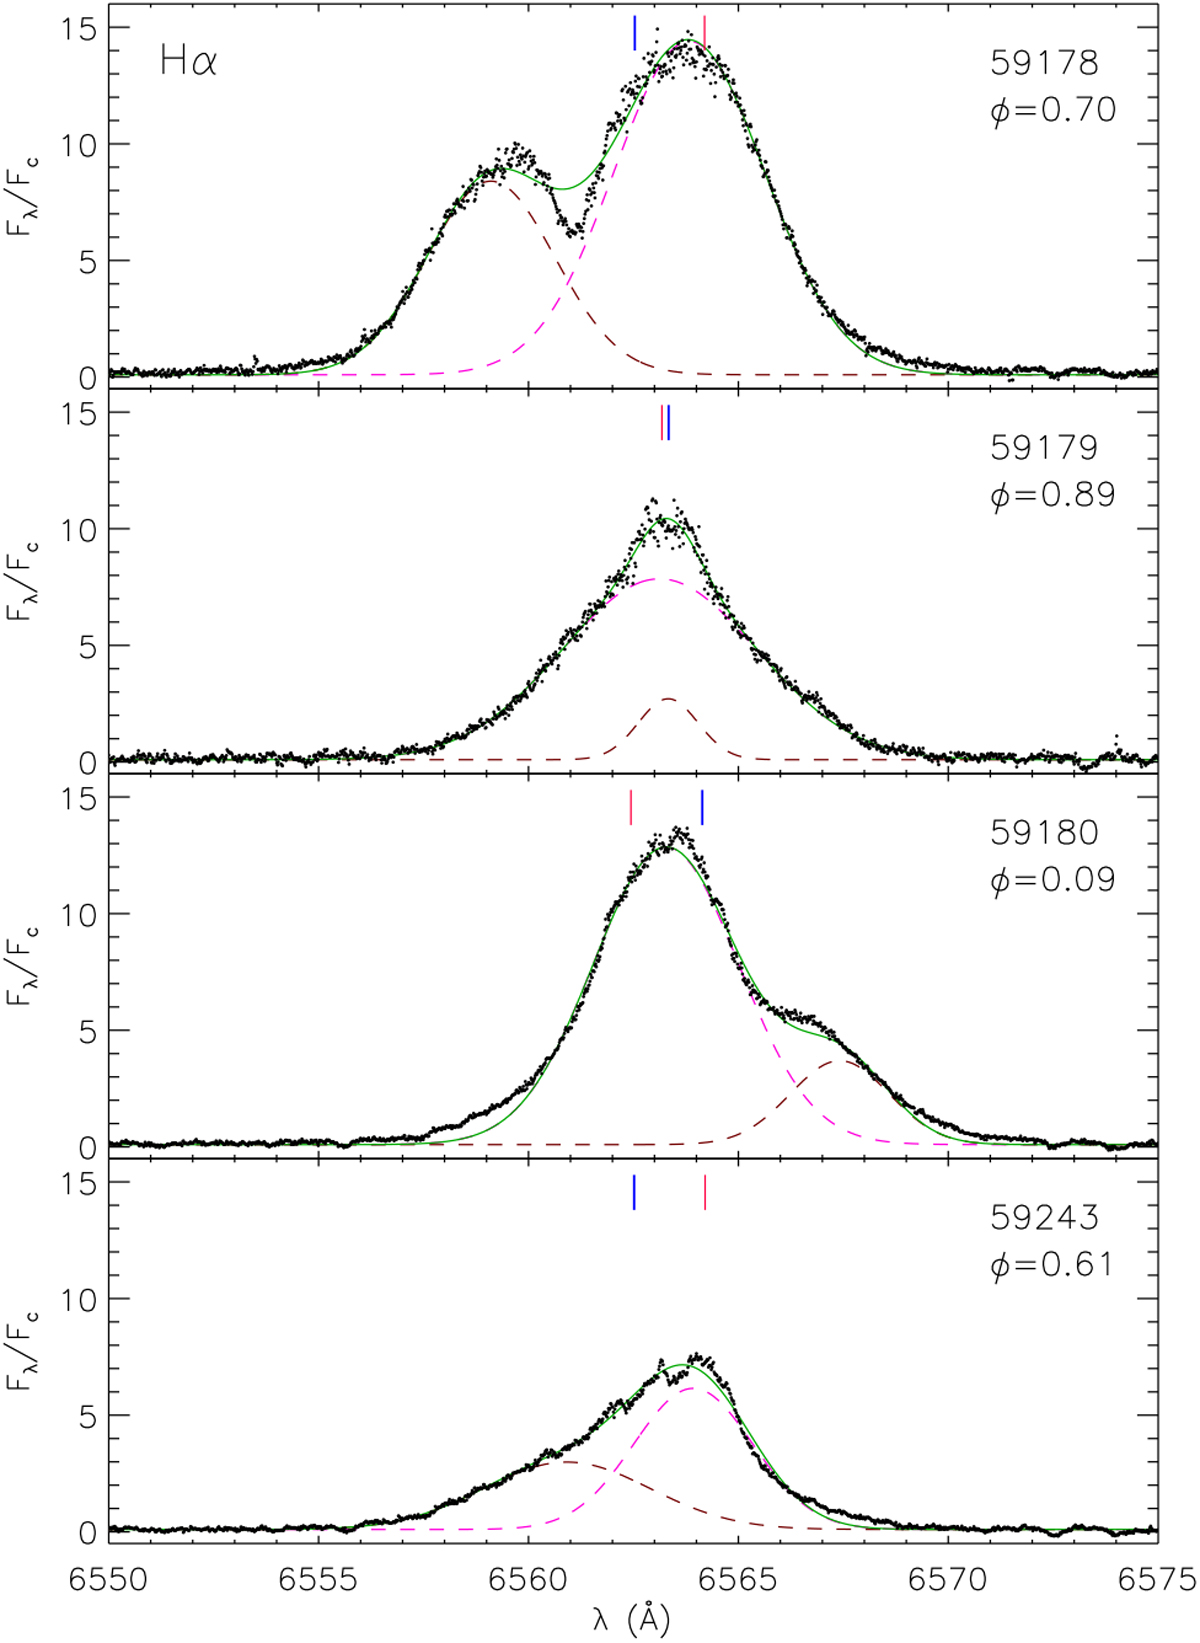
Residual UVES Hα profiles (black dots). The totally blended emission from the two stars is represented, in each box, by a magenta dashed line, while the brown dashed line is the Gaussian fitted to the excess blueshifted or redshifted emission. The sum of the two Gaussians is overplotted as a full green line. The blue and red vertical ticks mark the expected position of the lines of primary and secondary component, respectively, according to the photospheric RV.
Current usage metrics show cumulative count of Article Views (full-text article views including HTML views, PDF and ePub downloads, according to the available data) and Abstracts Views on Vision4Press platform.
Data correspond to usage on the plateform after 2015. The current usage metrics is available 48-96 hours after online publication and is updated daily on week days.
Initial download of the metrics may take a while.