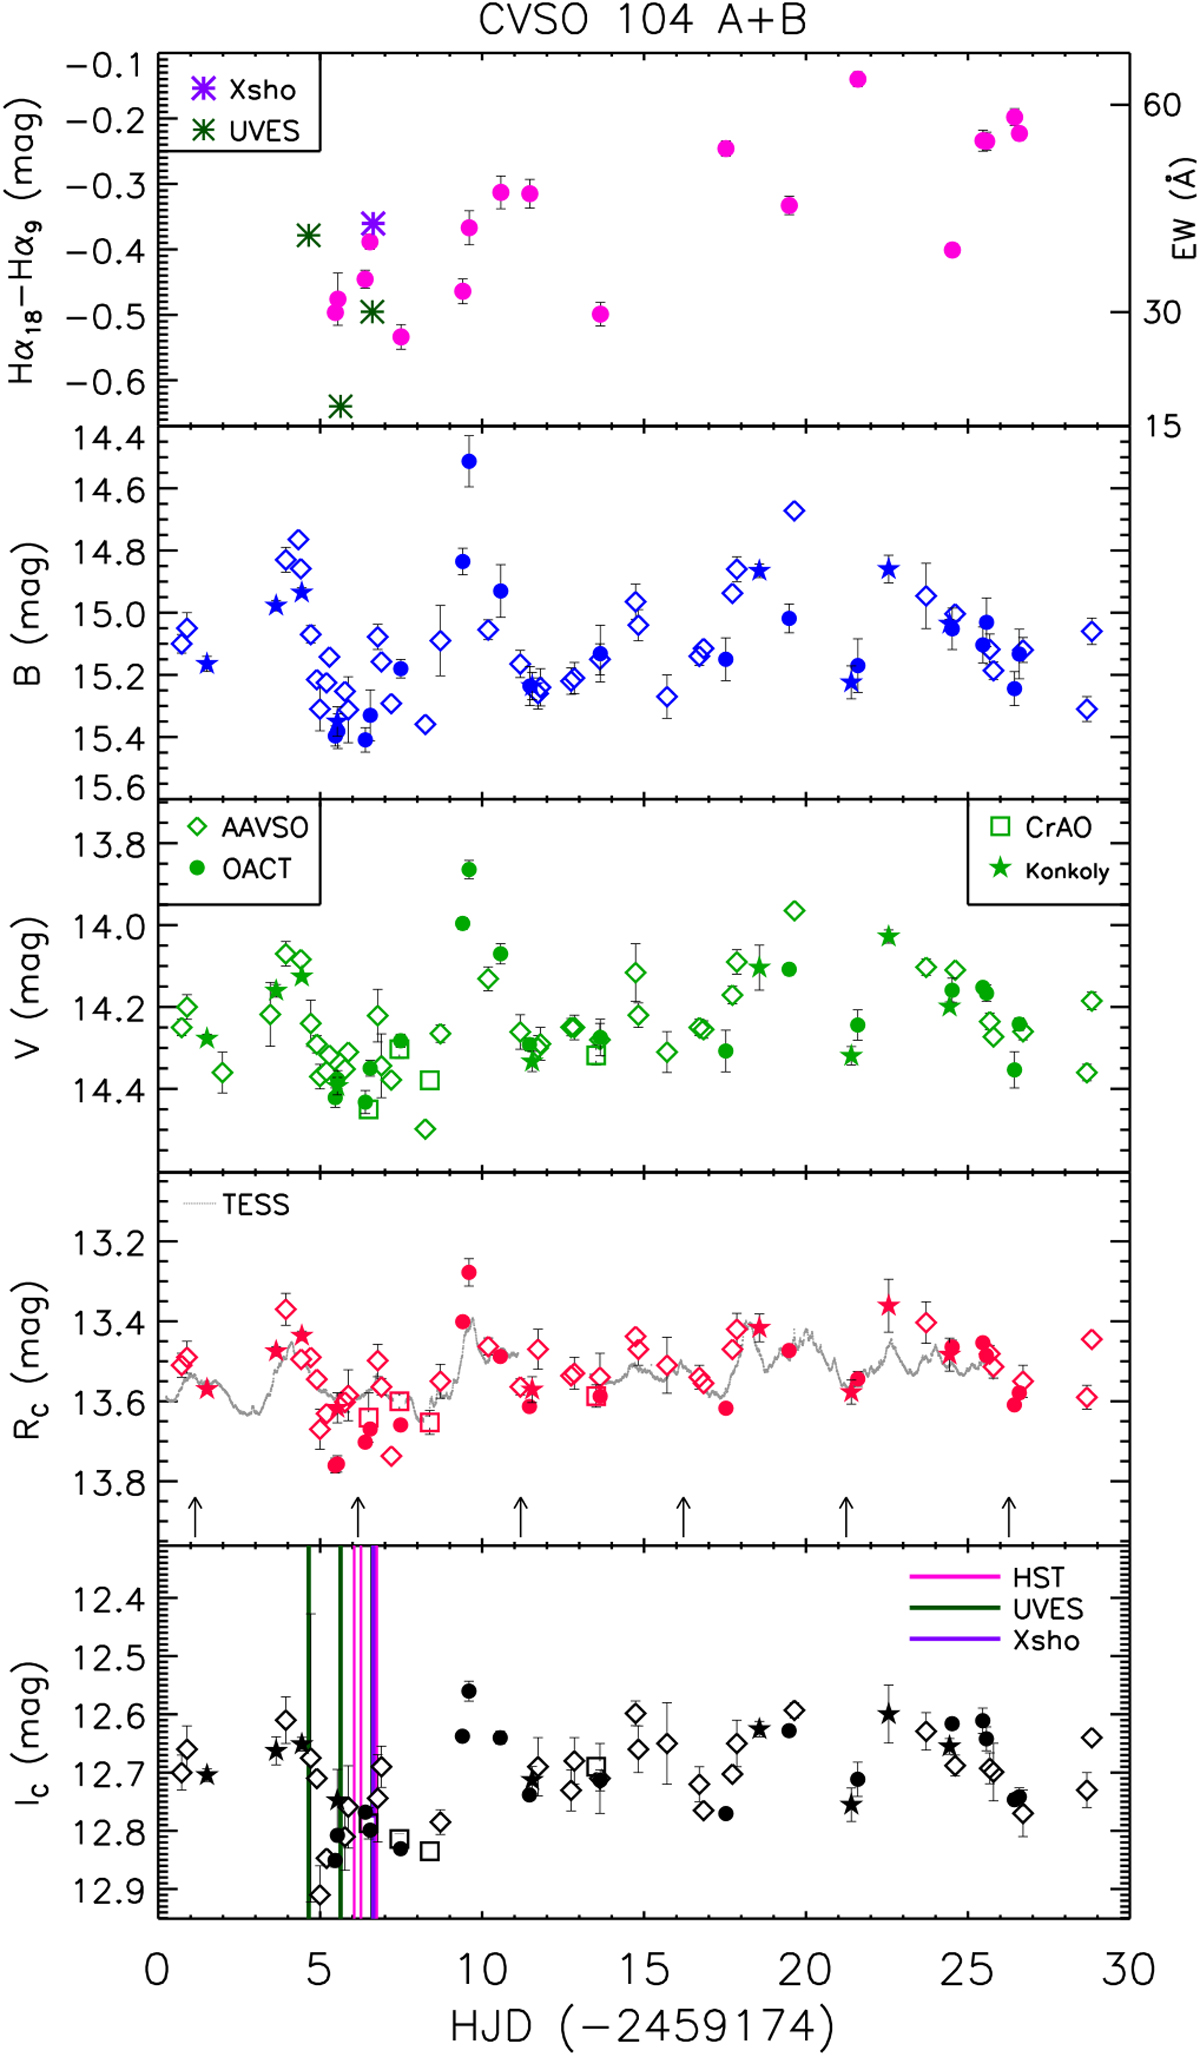
Fig. A.1
Download original image
Multiband ground-based light curve of CVSO 104 A+B around the time of VLT and HST observations. Different symbols, as reported in the legend, are used for the different data sets. The Hα color index, which measures the intensity of the line, is shown in the upper panel. Synthetic Hα colors based on X-shooter and UVES spectra are overplotted with asterisks in the same box. The contemporaneous TESS light curve is overplotted with grey dots to the RC light curve. The arrows in the same box mark the periastron passages. The epoch of VLT and HST observations are marked in the lower box.
Current usage metrics show cumulative count of Article Views (full-text article views including HTML views, PDF and ePub downloads, according to the available data) and Abstracts Views on Vision4Press platform.
Data correspond to usage on the plateform after 2015. The current usage metrics is available 48-96 hours after online publication and is updated daily on week days.
Initial download of the metrics may take a while.