Fig. 13
Download original image
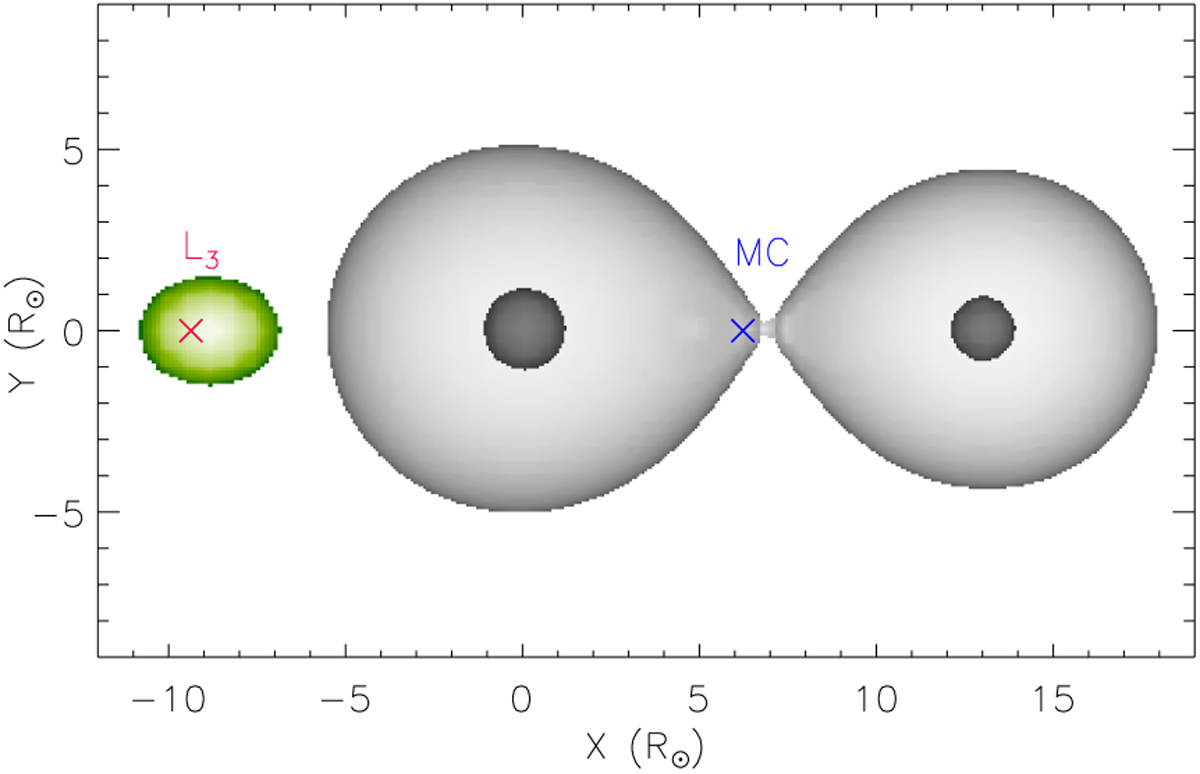
Schematic representation of the geometry of the CVSO 104 A system in the orbital plane. The dark shaded surfaces represent the primary (at left) and secondary component, while the light-grey one is the critical Roche surface. The size and separation of the stars and Roche lobes as well as the position of the barycenter (MC) and the Lagrangian point L3 are to scale. The source of the excess Hα and Hβ emission is represented by the shaded green area.
Current usage metrics show cumulative count of Article Views (full-text article views including HTML views, PDF and ePub downloads, according to the available data) and Abstracts Views on Vision4Press platform.
Data correspond to usage on the plateform after 2015. The current usage metrics is available 48-96 hours after online publication and is updated daily on week days.
Initial download of the metrics may take a while.