Fig. 11
Download original image
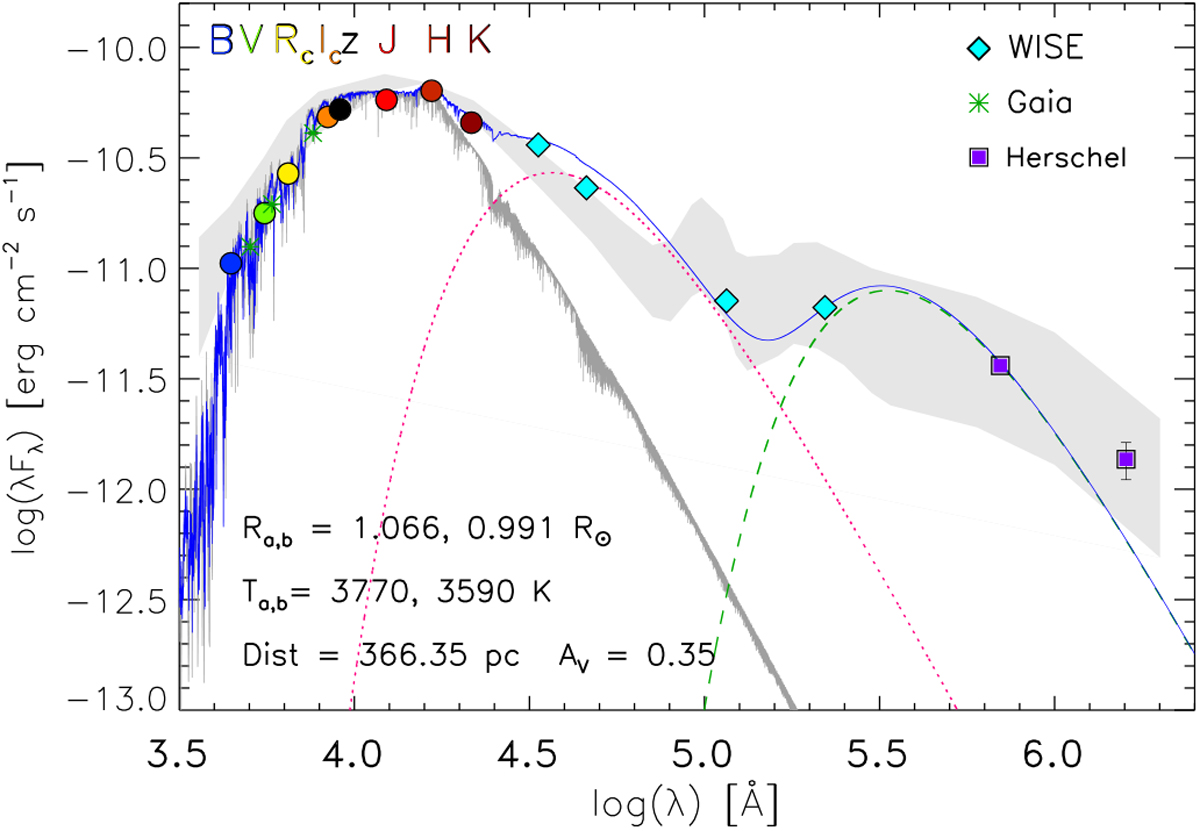
Spectral energy distribution of CVSO 104 A based on OACT and synthetic photometry made on the X-shooter spectrum. Gaia magnitudes, mid- and far-infrared fluxes are shown with different symbols, as indicated in the legend. The combination of BT-Settl spectra (Allard et al. 2012) that reproduce the photospheres of the components of the close binary is shown by a gray line. The two black bodies with T = 1000 K and T = 150 K that fit the MIR and FIR disk emission are shown by the dotted red and dashed green lines, respectively. The continuous blue line displays the sum of the smoothed photospheric template and the two black bodies. The light-grey shaded area in the background is the median SED of Class II Taurus sources according to D’Alessio et al. (1999) and Furlan et al. (2006), reddened by AV = 0.35 mag, and scaled to the H band photometric point.
Current usage metrics show cumulative count of Article Views (full-text article views including HTML views, PDF and ePub downloads, according to the available data) and Abstracts Views on Vision4Press platform.
Data correspond to usage on the plateform after 2015. The current usage metrics is available 48-96 hours after online publication and is updated daily on week days.
Initial download of the metrics may take a while.