Fig. 2.
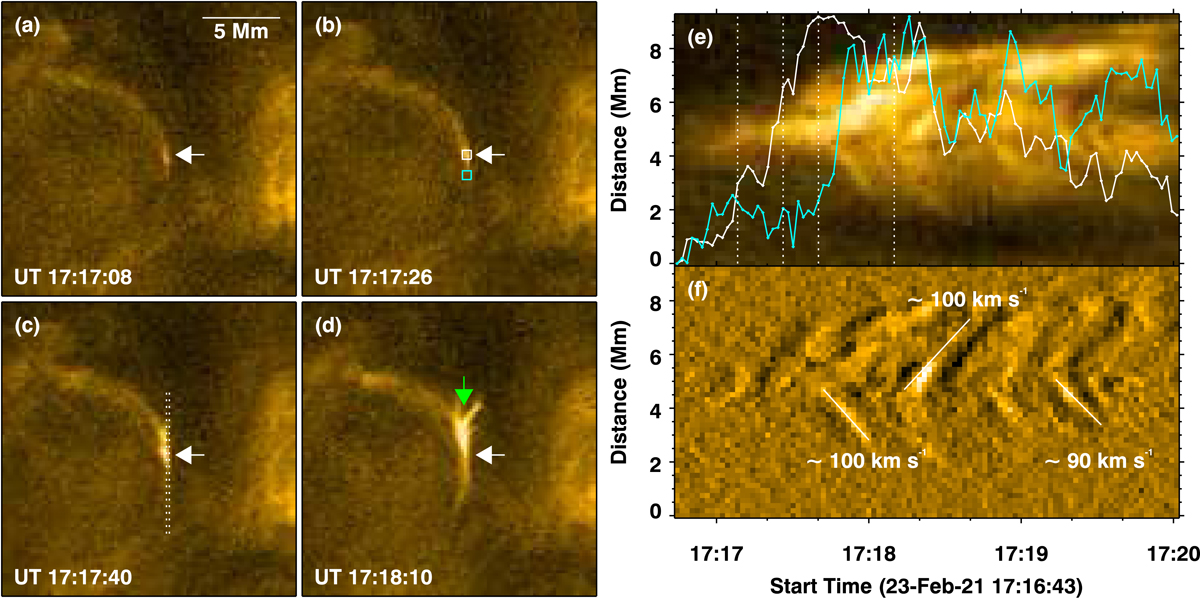
Download original image
Bidirectional jets. These transient jets are observed in the region outlined by box-A in Fig. 1. Panels a–d, covering an area of roughly 19 Mm × 19 Mm, display snapshots at four instances during the jet evolution. The white arrow points to the initial brightening and its location observed prior to the jet. Panel d: the green arrow points to a location where the jet is further bifurcated. The space-time stack plot in panel e shows the evolution of the brightness along the strip marked in panel c (emission averaged across dotted vertical lines, i.e. the strip). The overlaid light curve in white is from the location of the initial brightening (emission averaged over the white box in panel b). Similarly, the cyan coloured light curve represents average emission covering a region over the jet (cyan box in panel b). The vertical dotted lines mark the time-stamps associated with images in panels a–d. Panel f: a smooth-subtracted image of panel e. Fiducial (solid) lines are plotted to guide the eye. Their slopes, in units of speed (km s−1), are also quoted. An online animation of the snapshots is available.
Current usage metrics show cumulative count of Article Views (full-text article views including HTML views, PDF and ePub downloads, according to the available data) and Abstracts Views on Vision4Press platform.
Data correspond to usage on the plateform after 2015. The current usage metrics is available 48-96 hours after online publication and is updated daily on week days.
Initial download of the metrics may take a while.