Fig. 8.
Download original image
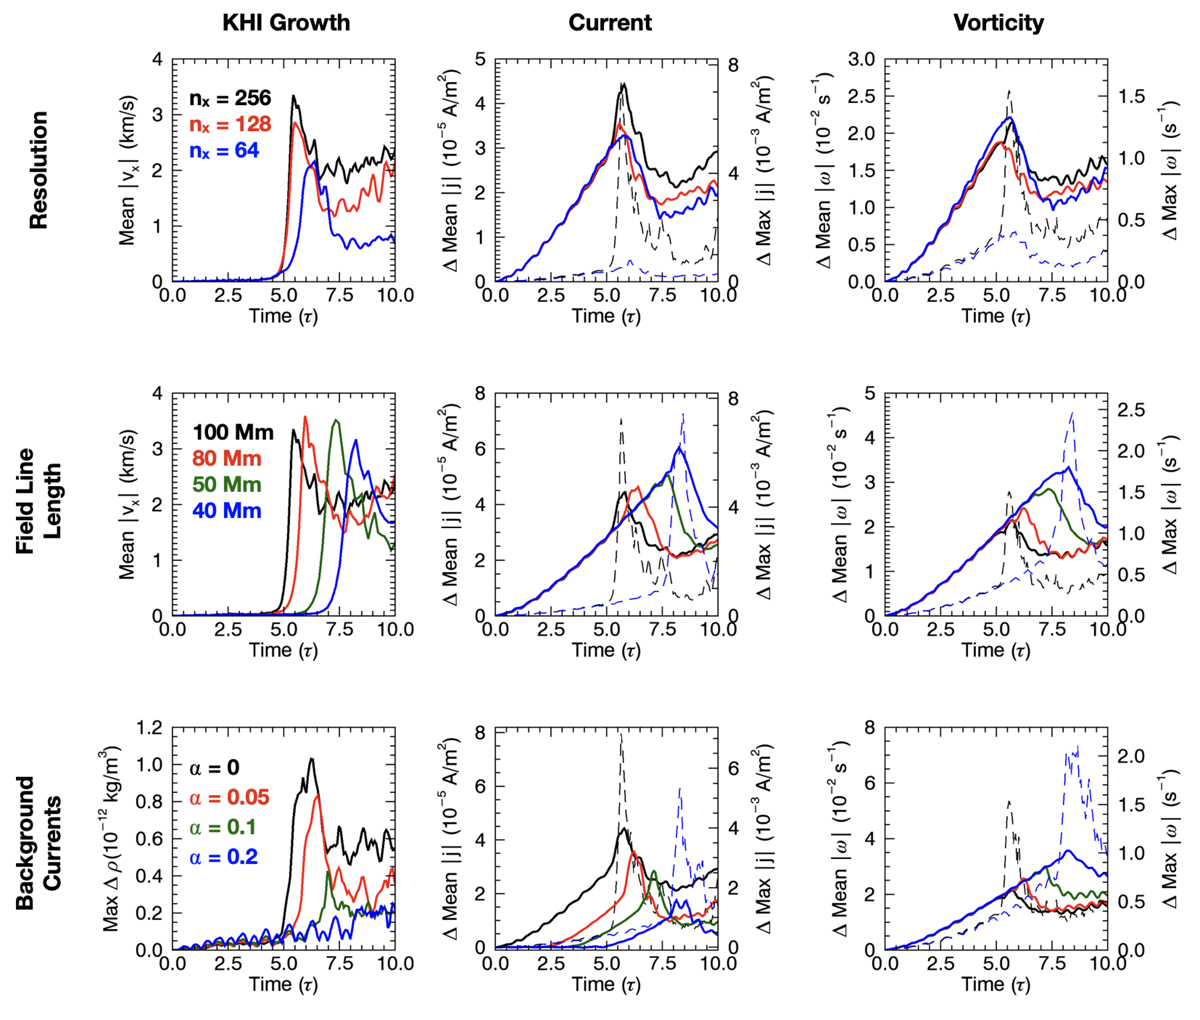
Growth rates of the KHI and small-scale formation for the numerical simulations considered within this article. We show the effects of numerical resolution, field line length and the inclusion of a shear component in the background field for the first, second and third rows respectively. The first column shows the growth rate of the instability (details in text). The second and third columns show the change in the mean (solid lines, left hand axis) and the change in the maximum (dashed lines, right hand axis) of the current density and the vorticity, respectively. In all cases, the change is calculated relative to the initial conditions.
Current usage metrics show cumulative count of Article Views (full-text article views including HTML views, PDF and ePub downloads, according to the available data) and Abstracts Views on Vision4Press platform.
Data correspond to usage on the plateform after 2015. The current usage metrics is available 48-96 hours after online publication and is updated daily on week days.
Initial download of the metrics may take a while.