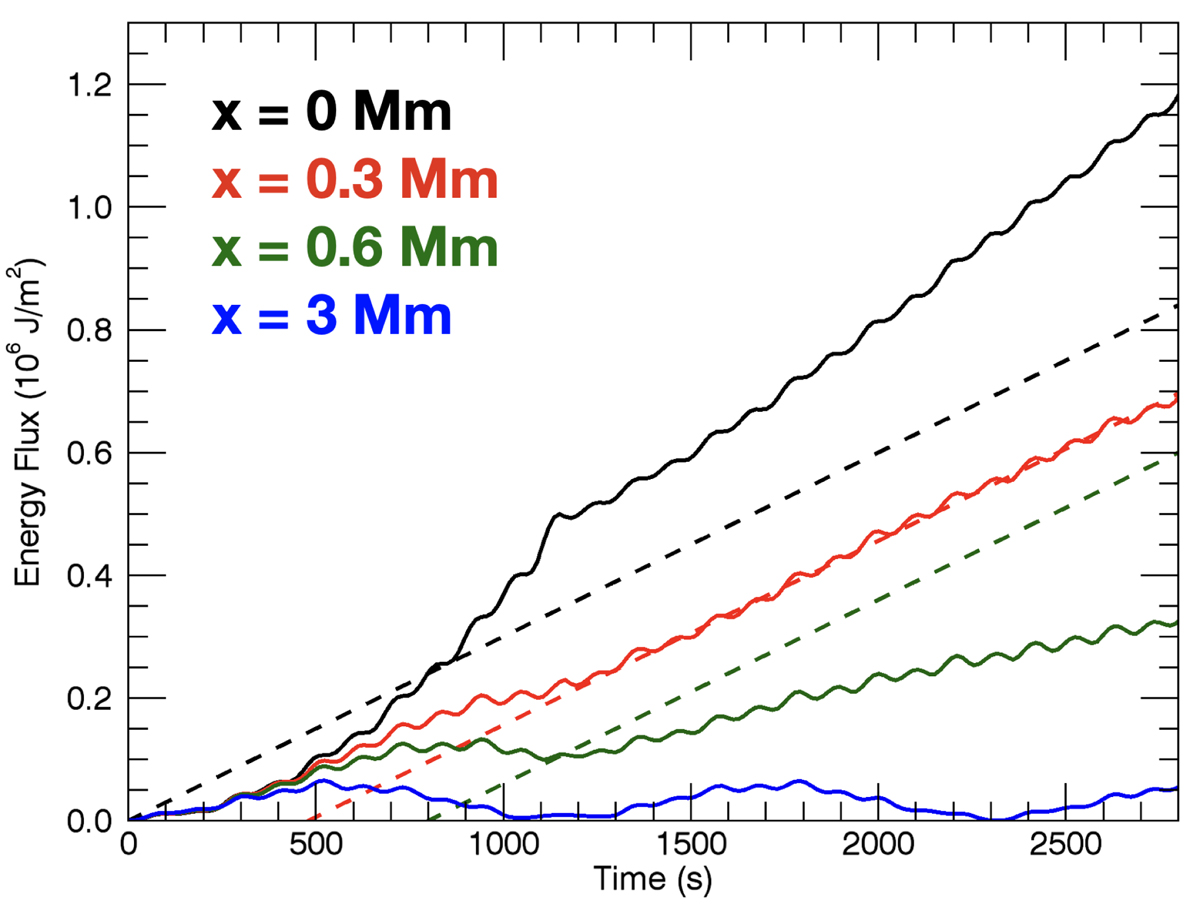
Fig. 7.
Download original image
Solid: cumulative Poynting flux injected through the lower z boundary by the imposed wave driver averaged along y for various values of x. Dashed: estimated energy requirements in typical Quiet Sun conditions. The losses shown by the red dashed line are delayed to show that the mean Poynting flux for x = 0.3 Mm is sufficient to balance expected Quiet Sun losses once the Kelvin-Helmholtz instability forms. Conversely, the green dashed line shows that the mean Poynting flux for x = 0.6 Mm is not sufficient even once the instability has developed.
Current usage metrics show cumulative count of Article Views (full-text article views including HTML views, PDF and ePub downloads, according to the available data) and Abstracts Views on Vision4Press platform.
Data correspond to usage on the plateform after 2015. The current usage metrics is available 48-96 hours after online publication and is updated daily on week days.
Initial download of the metrics may take a while.