Free Access
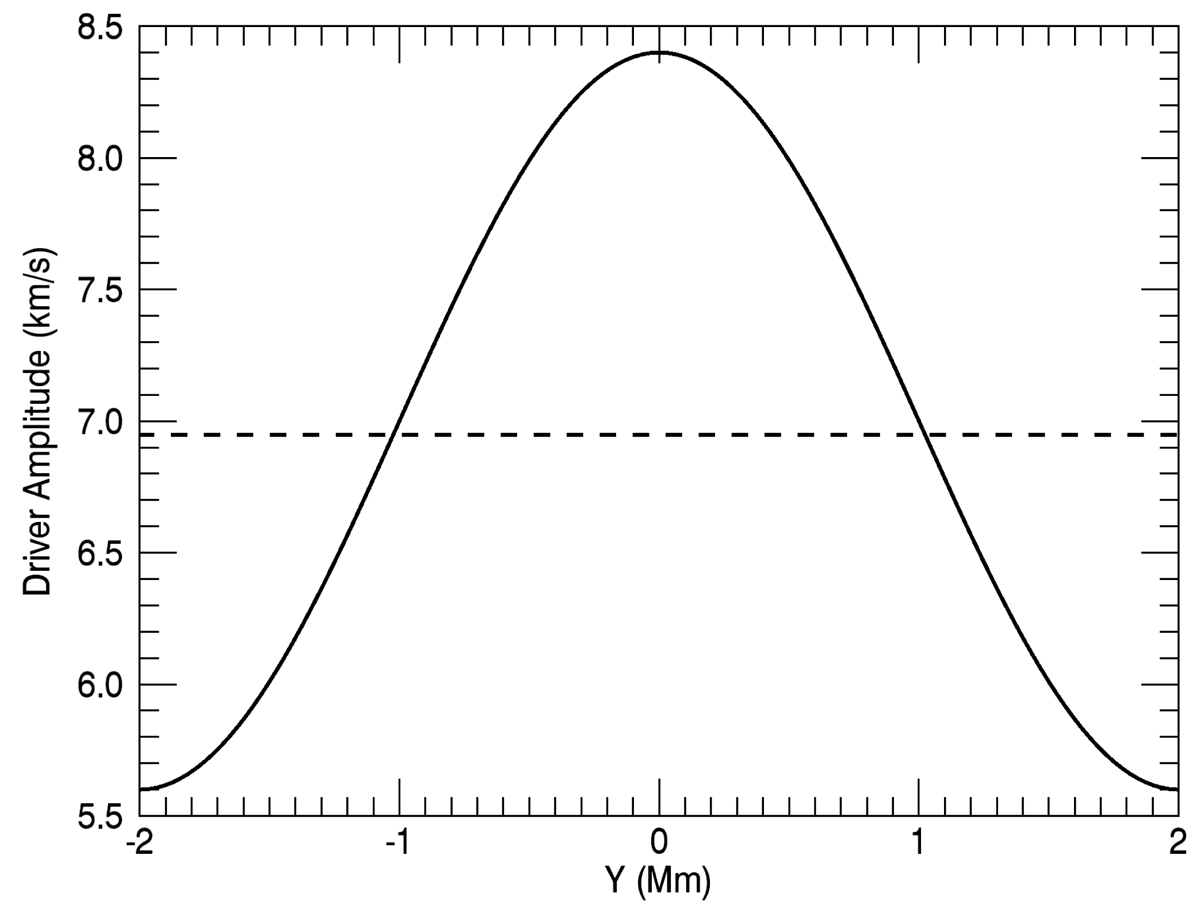
Fig. 3.
Download original image
Solid line: amplitude of the driving velocity as a function of y. Dashed line: profile of vy(y) at the mid-plane of the domain when the peak of the first wave front reaches this height.
Current usage metrics show cumulative count of Article Views (full-text article views including HTML views, PDF and ePub downloads, according to the available data) and Abstracts Views on Vision4Press platform.
Data correspond to usage on the plateform after 2015. The current usage metrics is available 48-96 hours after online publication and is updated daily on week days.
Initial download of the metrics may take a while.