Fig. 17.
Download original image
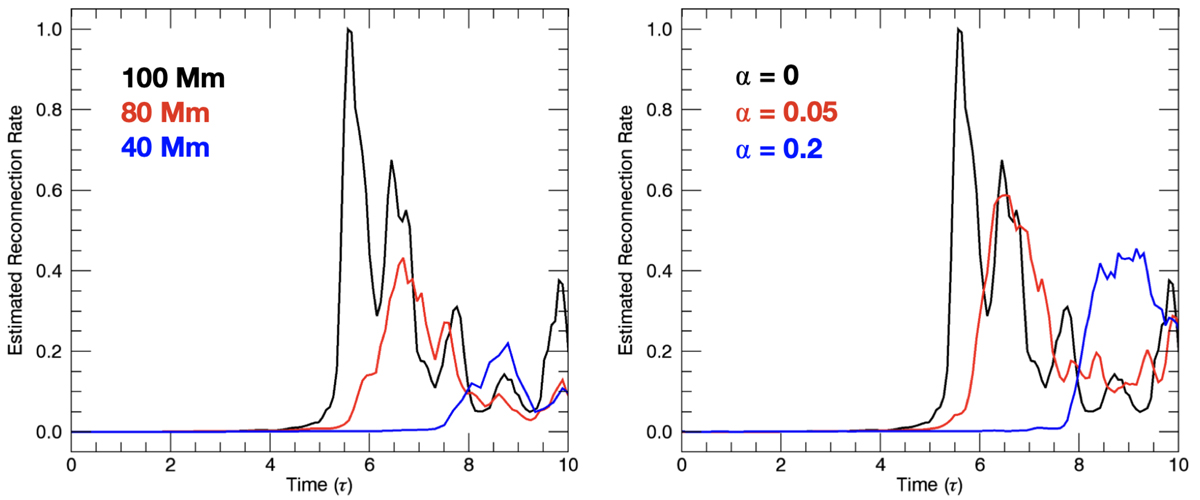
Estimated reconnection rate calculated using Eq. (20). In the left hand panel, we show the effects of field line length using simulations with l = 100 Mm (black), l = 80 Mm (red) and l = 40 Mm (blue). In the right hand panel, we show the effects of shear in the background field using the simulations with α = 0 (no shear; black), α = 0.05 (low shear; red) and α = 0.2 (high shear; blue). Here we have normalised the rates by the maximum of the 100 Mm, α = 0 case (black line).
Current usage metrics show cumulative count of Article Views (full-text article views including HTML views, PDF and ePub downloads, according to the available data) and Abstracts Views on Vision4Press platform.
Data correspond to usage on the plateform after 2015. The current usage metrics is available 48-96 hours after online publication and is updated daily on week days.
Initial download of the metrics may take a while.