Fig. 16.
Download original image
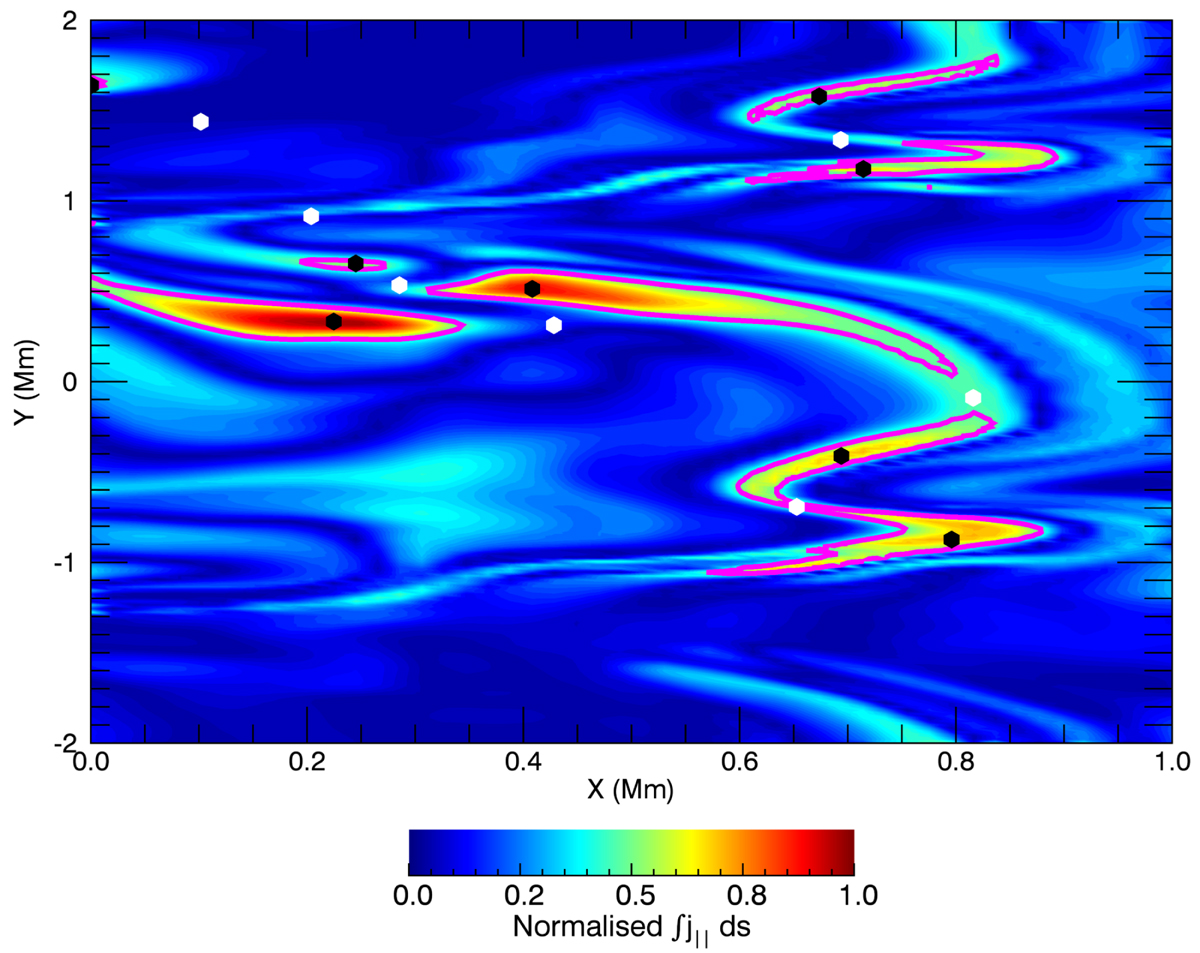
Contours show the parallel component of the current integrated over field lines traced from the lower z boundary. Any given location corresponds to the position of the foot point of a magnetic field line. The pink line shows a level equal to half of the maximum value of the integral (0.5). Local maxima within the pink contour are identified with black points and the loci of associated saddle points are indicated with white points.
Current usage metrics show cumulative count of Article Views (full-text article views including HTML views, PDF and ePub downloads, according to the available data) and Abstracts Views on Vision4Press platform.
Data correspond to usage on the plateform after 2015. The current usage metrics is available 48-96 hours after online publication and is updated daily on week days.
Initial download of the metrics may take a while.