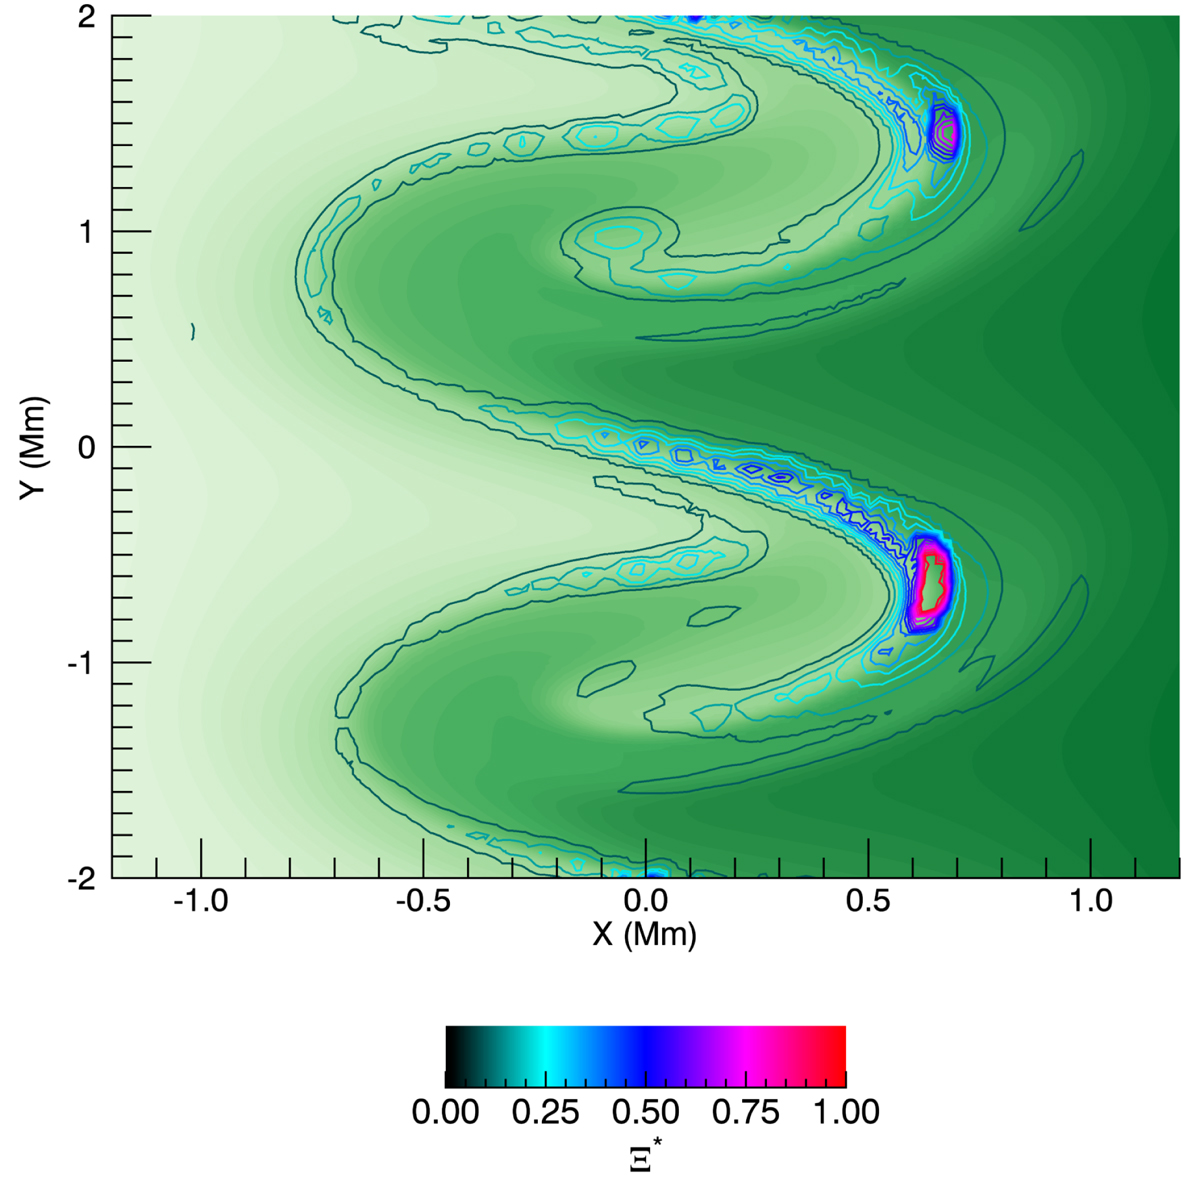
Fig. 15.
Download original image
Filled green contours: density profile at z = 0 Mm. The colour table used for the density is the same as in Figs. 5, 11 and 13. Line contours: value of Ξ* (see Eq. (19)) for field lines embedded within the Kelvin-Helmholtz mixing layer. The time shown is t ≈ 1090 s for the straight field, high resolution, l = 100 Mm simulation. We have normalised using the maximum value of Ξ* at this time. For clarity, we have restricted the x axis in each panel to −1.2 Mm ≤ x ≤ 1.2 Mm.
Current usage metrics show cumulative count of Article Views (full-text article views including HTML views, PDF and ePub downloads, according to the available data) and Abstracts Views on Vision4Press platform.
Data correspond to usage on the plateform after 2015. The current usage metrics is available 48-96 hours after online publication and is updated daily on week days.
Initial download of the metrics may take a while.