Fig. 10.
Download original image
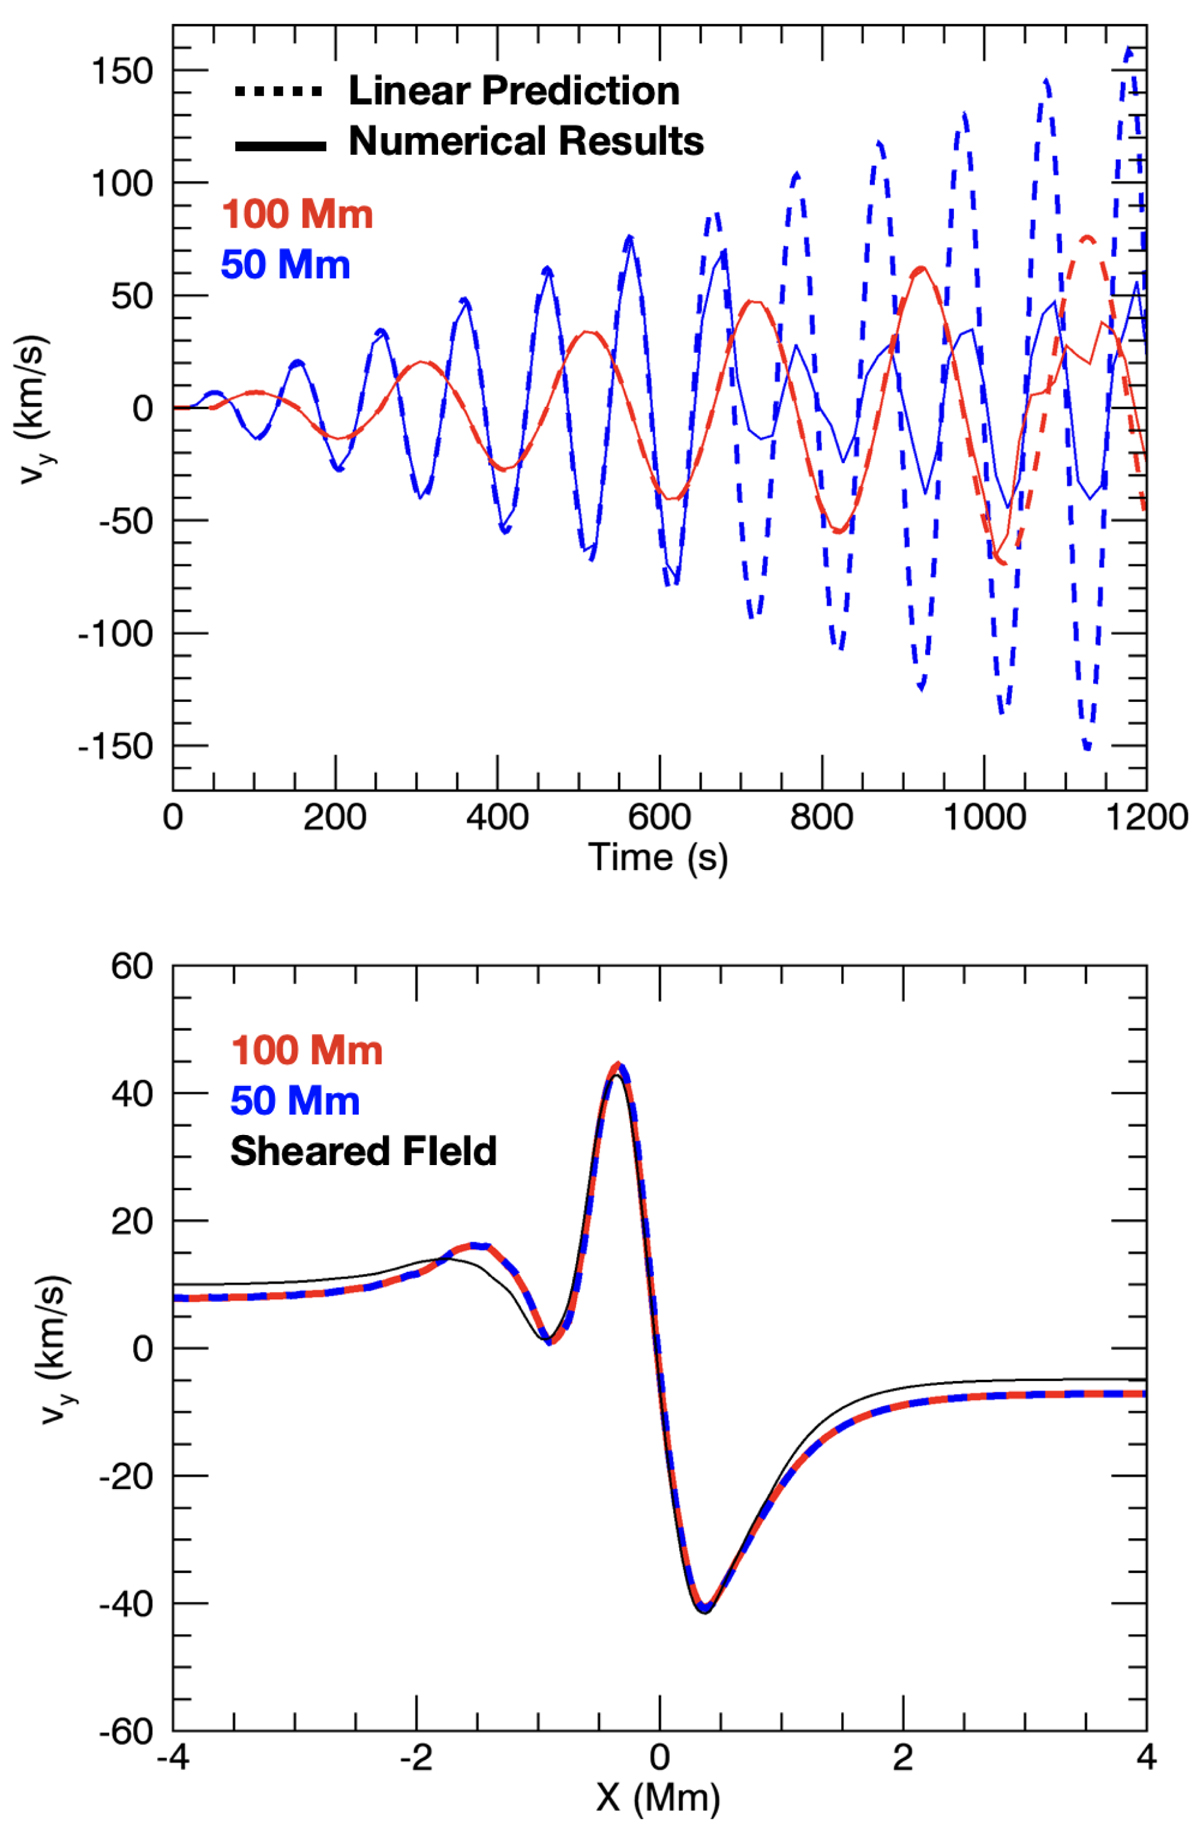
Upper: amplitudes of resonant wave for l = 50 Mm (blue) and l = 100 Mm (red). Dashed lines show prediction from Eq. (13) and solid lines are results from numerical simulations. Lower: cross-field phase mixing profile for l = 50 Mm at t = 475 s (blue) and l = 100 Mm (red) at t = 950 s (red). The thin black line corresponds to a simulation with shear in the background field and is discussed in Sect. 3.4.
Current usage metrics show cumulative count of Article Views (full-text article views including HTML views, PDF and ePub downloads, according to the available data) and Abstracts Views on Vision4Press platform.
Data correspond to usage on the plateform after 2015. The current usage metrics is available 48-96 hours after online publication and is updated daily on week days.
Initial download of the metrics may take a while.