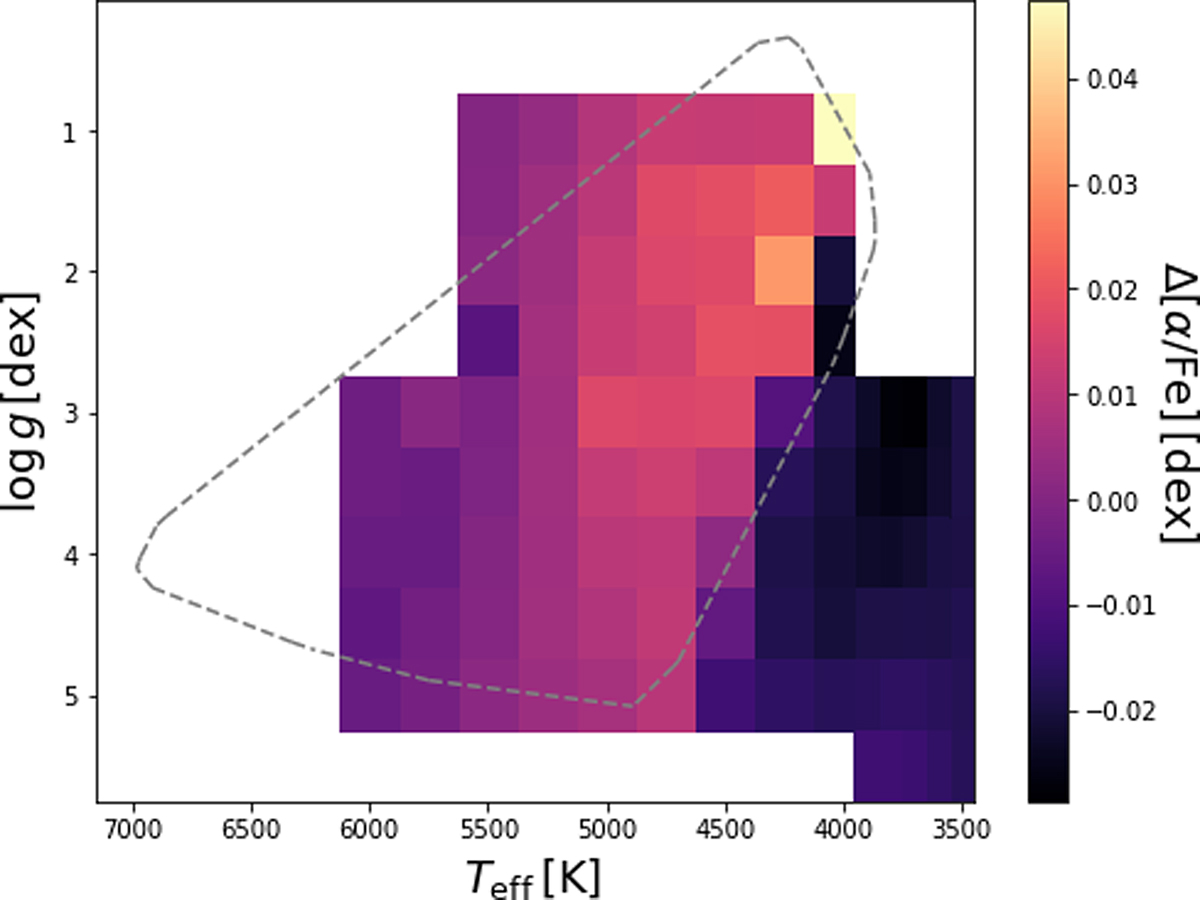
Fig. 13.
Download original image
Difference Δ[α/Fe] between estimated average [α/Fe] for the α-rich and α-poor stars in the synthetic sample, after training on the GALAH sample. For each Teff–log g node, the average is taken over [Fe/H] and A0. Convex hull of training sample shown as dashed line. We note that if this plot had used the same colour scale as in Fig. 9, it would seem almost uniform to the eye.
Current usage metrics show cumulative count of Article Views (full-text article views including HTML views, PDF and ePub downloads, according to the available data) and Abstracts Views on Vision4Press platform.
Data correspond to usage on the plateform after 2015. The current usage metrics is available 48-96 hours after online publication and is updated daily on week days.
Initial download of the metrics may take a while.