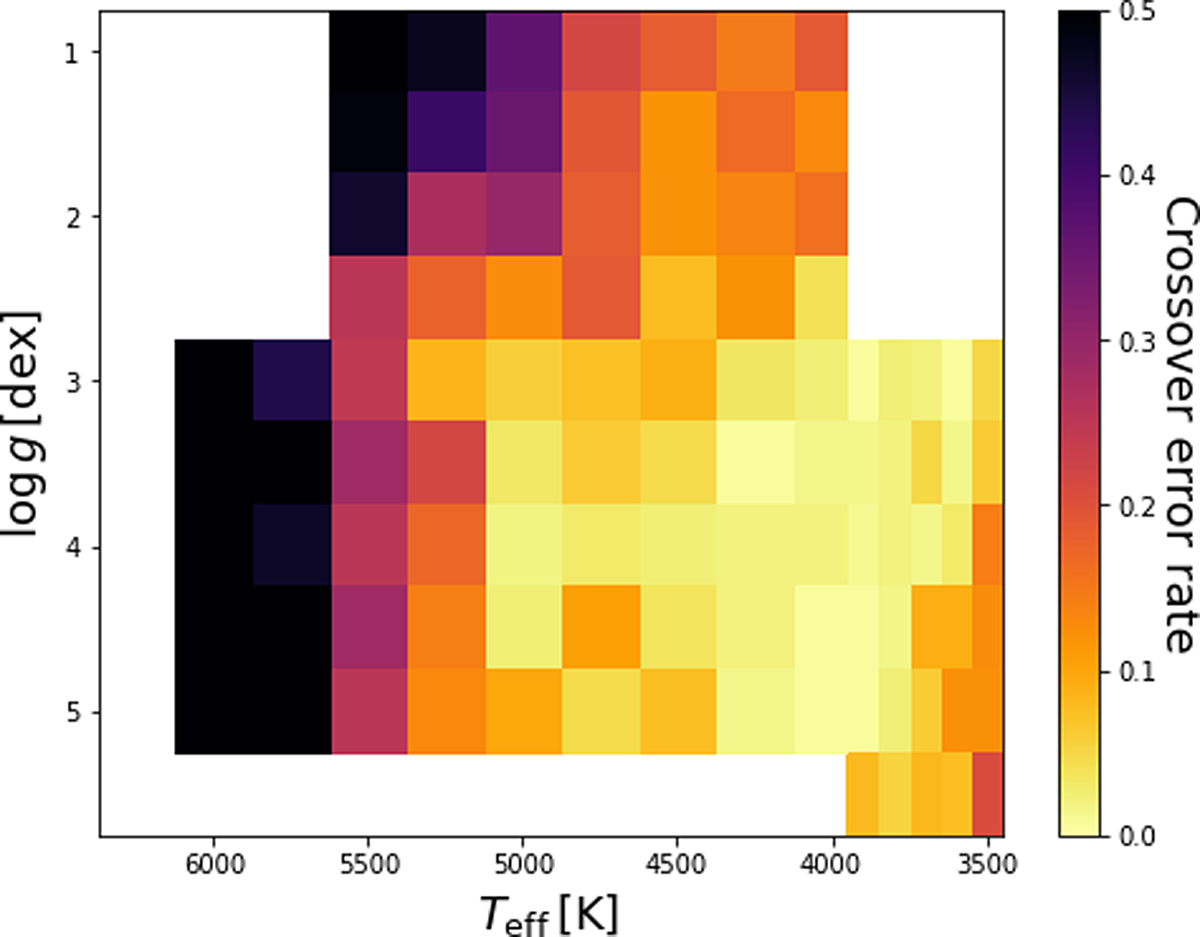
Fig. 10.
Download original image
Crossover error rate (CER) when attempting to distinguish α-rich and α-poor spectra when imposing a threshold [α/Fe] on the estimates derived during cross-validation of the synthetic sample. The black region around 6000 K has a CER near 50%, indicating that the α-rich and α-poor spectra are practically indistinguishable. The pale yellow region around 4000 K has a CER below 10%, indicating that the α-rich and α-poor spectra can easily be told apart.
Current usage metrics show cumulative count of Article Views (full-text article views including HTML views, PDF and ePub downloads, according to the available data) and Abstracts Views on Vision4Press platform.
Data correspond to usage on the plateform after 2015. The current usage metrics is available 48-96 hours after online publication and is updated daily on week days.
Initial download of the metrics may take a while.