Fig. 9.
Download original image
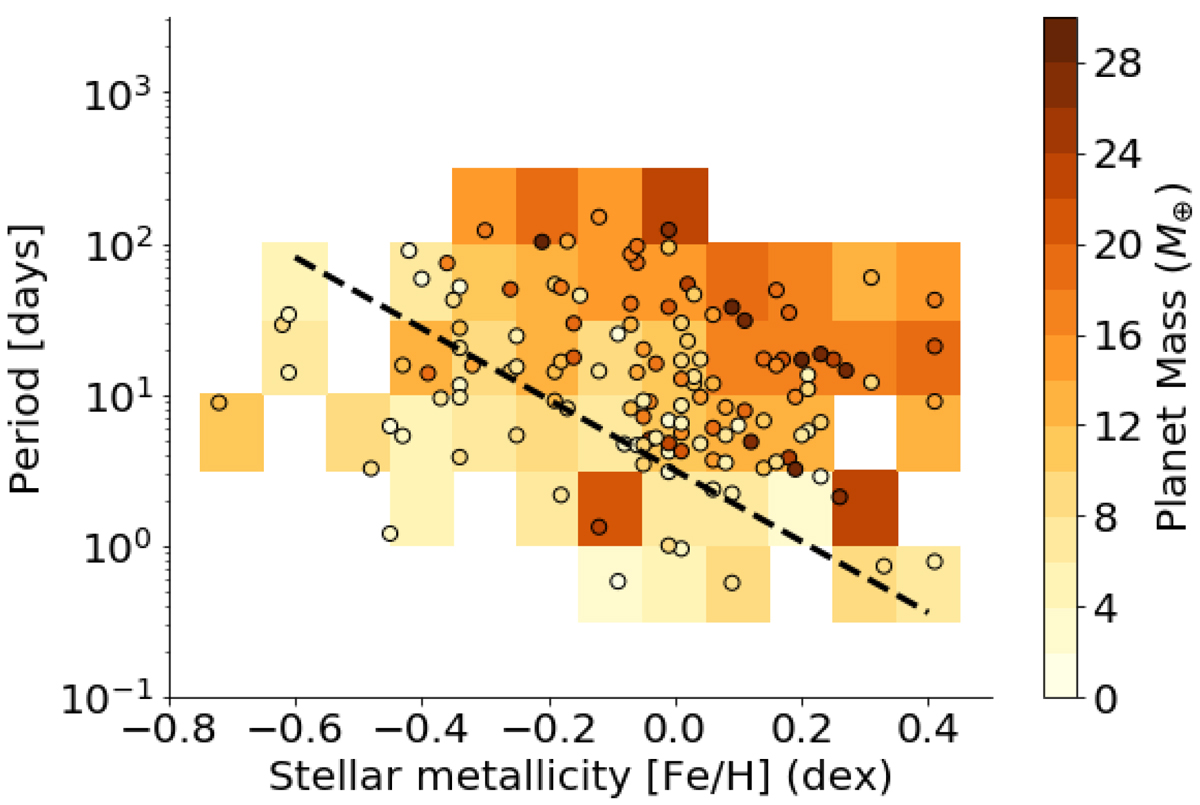
Updated metallicity-period-mass diagram for low-mass planets (< 30 M⊕) with planetary masses derived with at least 20% precision. The color scheme represents the planet mass (in M⊕). The colored background corresponds to the diagram binned average planet mass. The dashed black line is the linear fit of the data for a planet mass of 10 M⊕.
Current usage metrics show cumulative count of Article Views (full-text article views including HTML views, PDF and ePub downloads, according to the available data) and Abstracts Views on Vision4Press platform.
Data correspond to usage on the plateform after 2015. The current usage metrics is available 48-96 hours after online publication and is updated daily on week days.
Initial download of the metrics may take a while.