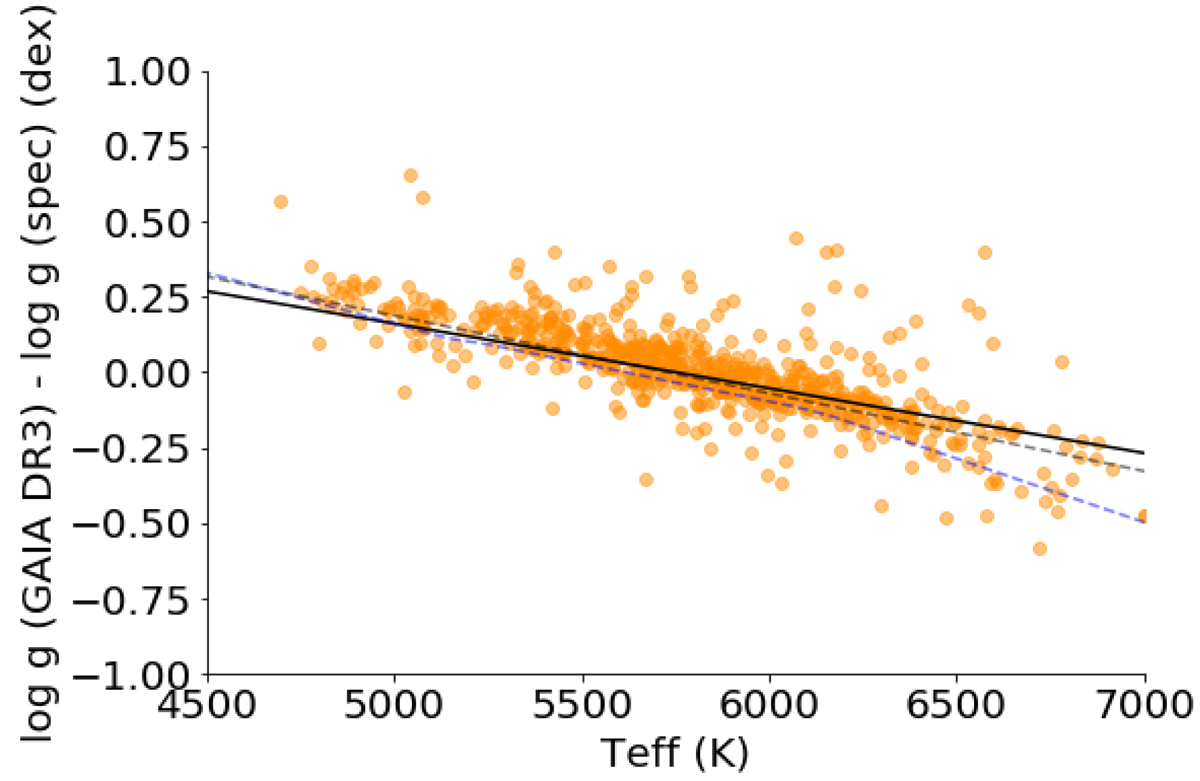
Fig. 4.
Download original image
Difference between the trigonometric and the spectroscopic surface gravities as a function of effective temperature for dwarf stars (log g > 4.0 dex) in SWEET-Cat. The black lines show the linear fit represented in Eq. (4), while the gray and blue dashed lines are fits presented in Fig. 5 of Tsantaki et al. (2013) and Fig. 2 of Delgado Mena et al. (2017), respectively.
Current usage metrics show cumulative count of Article Views (full-text article views including HTML views, PDF and ePub downloads, according to the available data) and Abstracts Views on Vision4Press platform.
Data correspond to usage on the plateform after 2015. The current usage metrics is available 48-96 hours after online publication and is updated daily on week days.
Initial download of the metrics may take a while.