Fig. 3.
Download original image
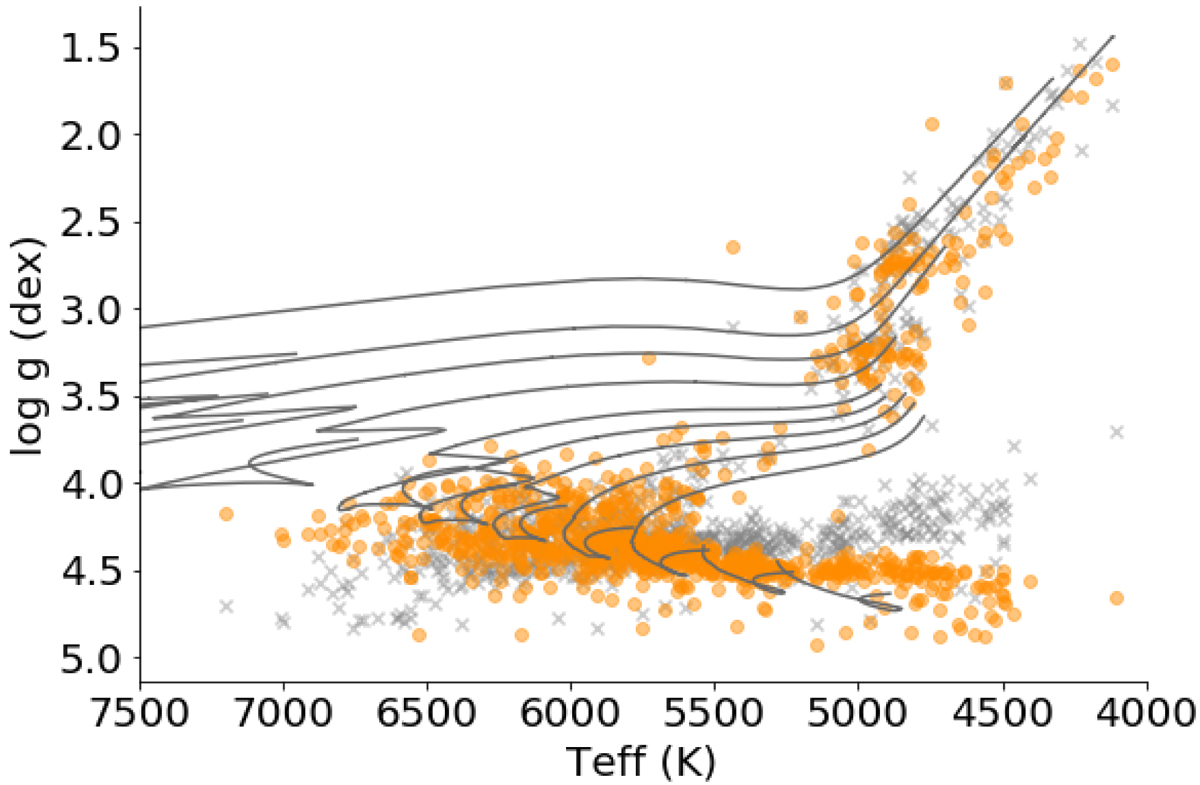
Surface gravity vs. effective temperature as a proxy of the Hertzprung–Russell diagram. The black lines represent CESAM evolution model tracks for stellar masses ranging from 0.8 to 2.4 M⊙. The trigonometric surface gravities computed using the Gaia eDR3 parallaxes (orange circles) are in better agreement with the model tracks than the spectroscopic values (gray crosses) for the dwarf stars.
Current usage metrics show cumulative count of Article Views (full-text article views including HTML views, PDF and ePub downloads, according to the available data) and Abstracts Views on Vision4Press platform.
Data correspond to usage on the plateform after 2015. The current usage metrics is available 48-96 hours after online publication and is updated daily on week days.
Initial download of the metrics may take a while.