Fig. 6
Download original image
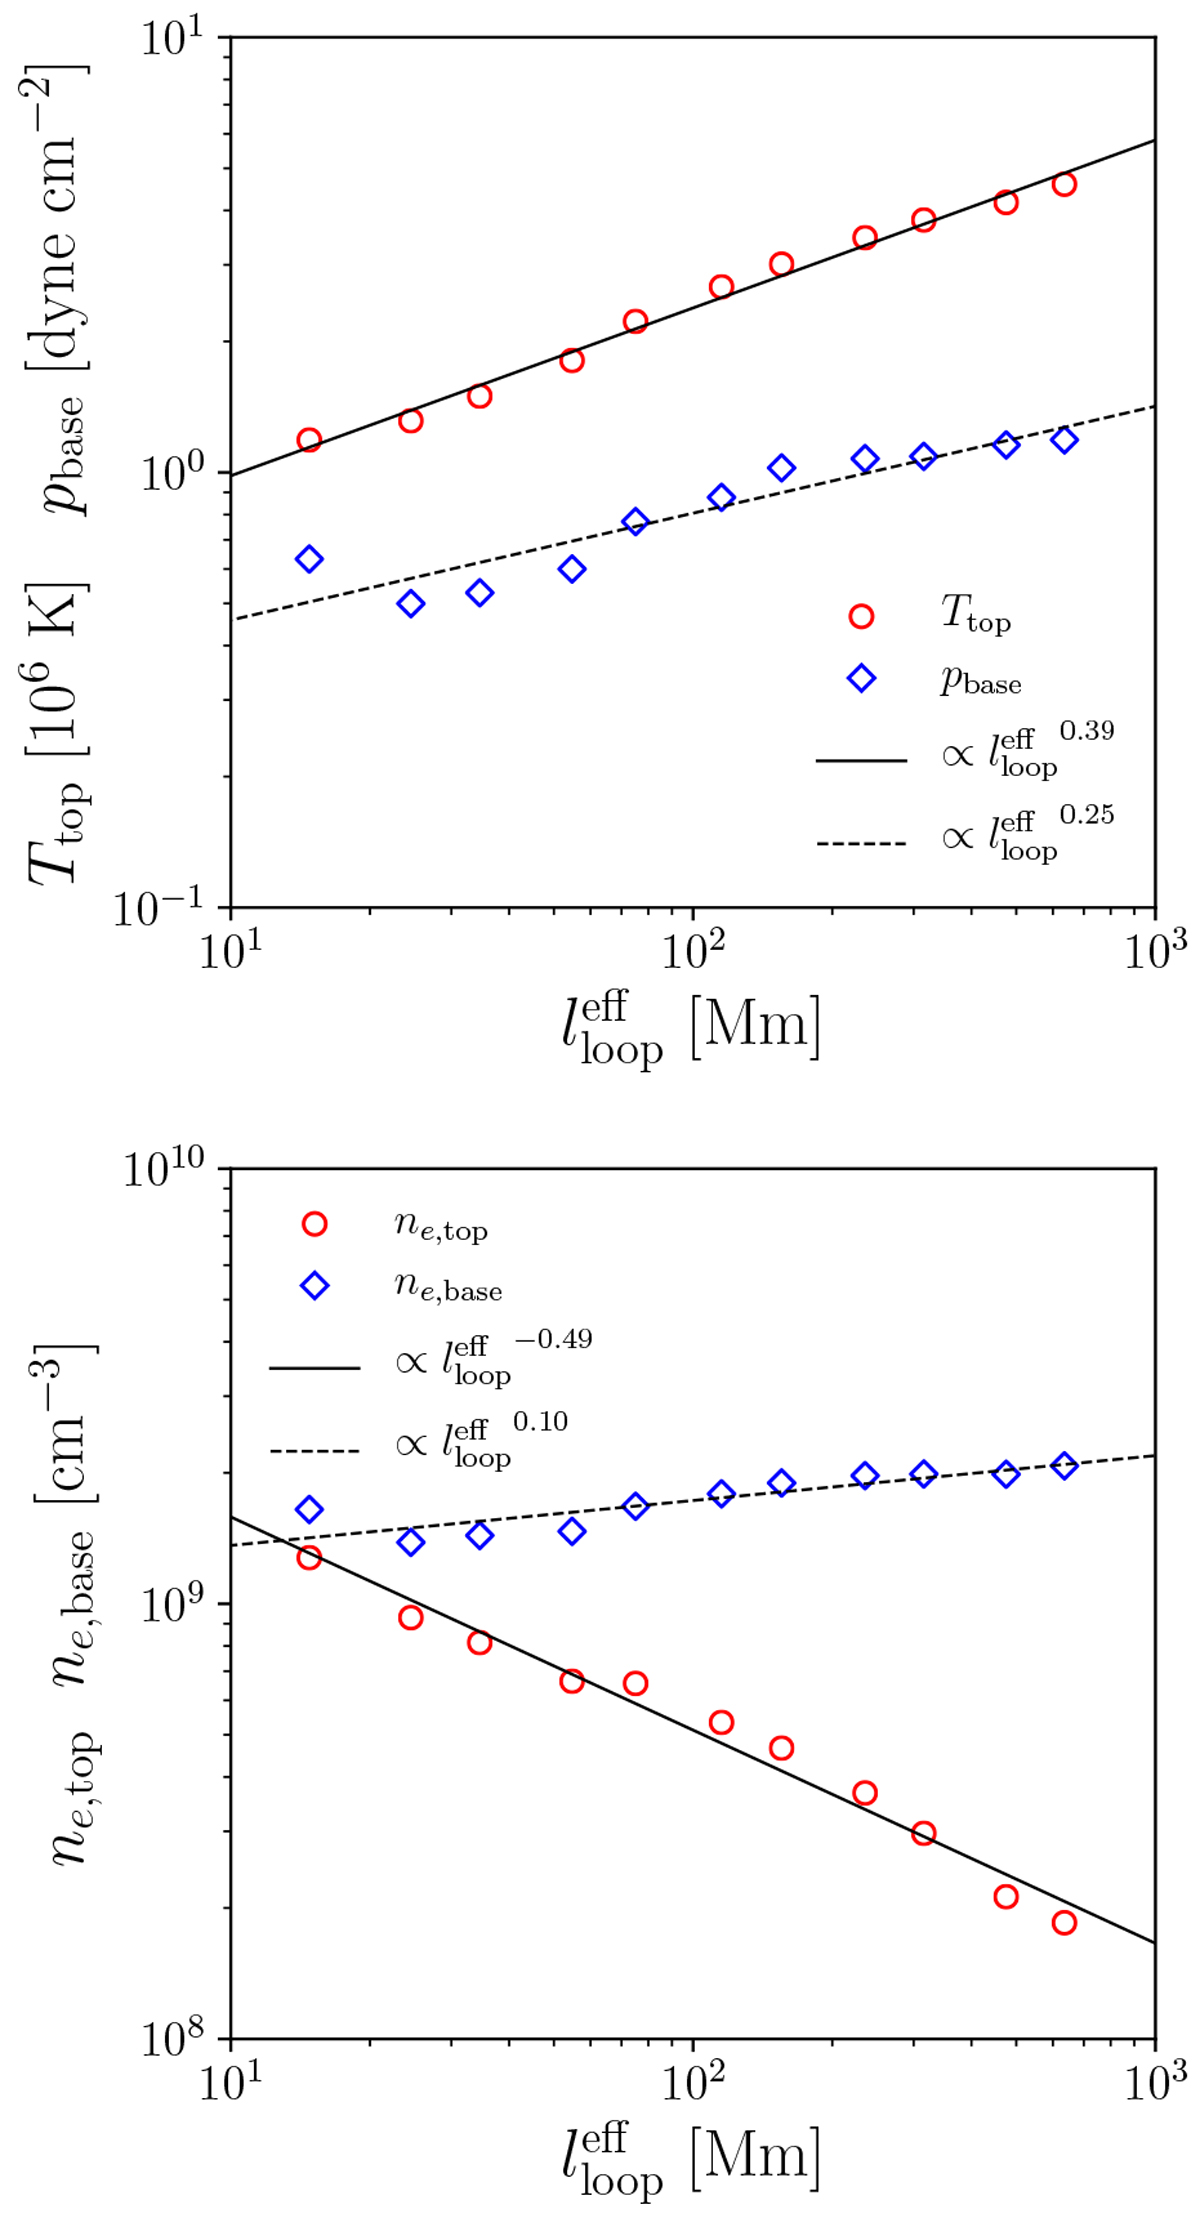
Coronal-property dependences on the effective loop length. Top: relation between the effective half loop length
![]() (see Eq. (63) for definition) and the time-averaged loop-top temperature (Ttop, red circles) and coronal-base pressure (pbase, blue diamonds). Bottom: relation between the effective half loop length
(see Eq. (63) for definition) and the time-averaged loop-top temperature (Ttop, red circles) and coronal-base pressure (pbase, blue diamonds). Bottom: relation between the effective half loop length ![]() and the time-averaged loop-top electron density (ne,top, red circles) and coronal-base electron density (ne,base, blue diamonds). In both panels, lines represent the power-law fittings to the symbols.
and the time-averaged loop-top electron density (ne,top, red circles) and coronal-base electron density (ne,base, blue diamonds). In both panels, lines represent the power-law fittings to the symbols.
Current usage metrics show cumulative count of Article Views (full-text article views including HTML views, PDF and ePub downloads, according to the available data) and Abstracts Views on Vision4Press platform.
Data correspond to usage on the plateform after 2015. The current usage metrics is available 48-96 hours after online publication and is updated daily on week days.
Initial download of the metrics may take a while.