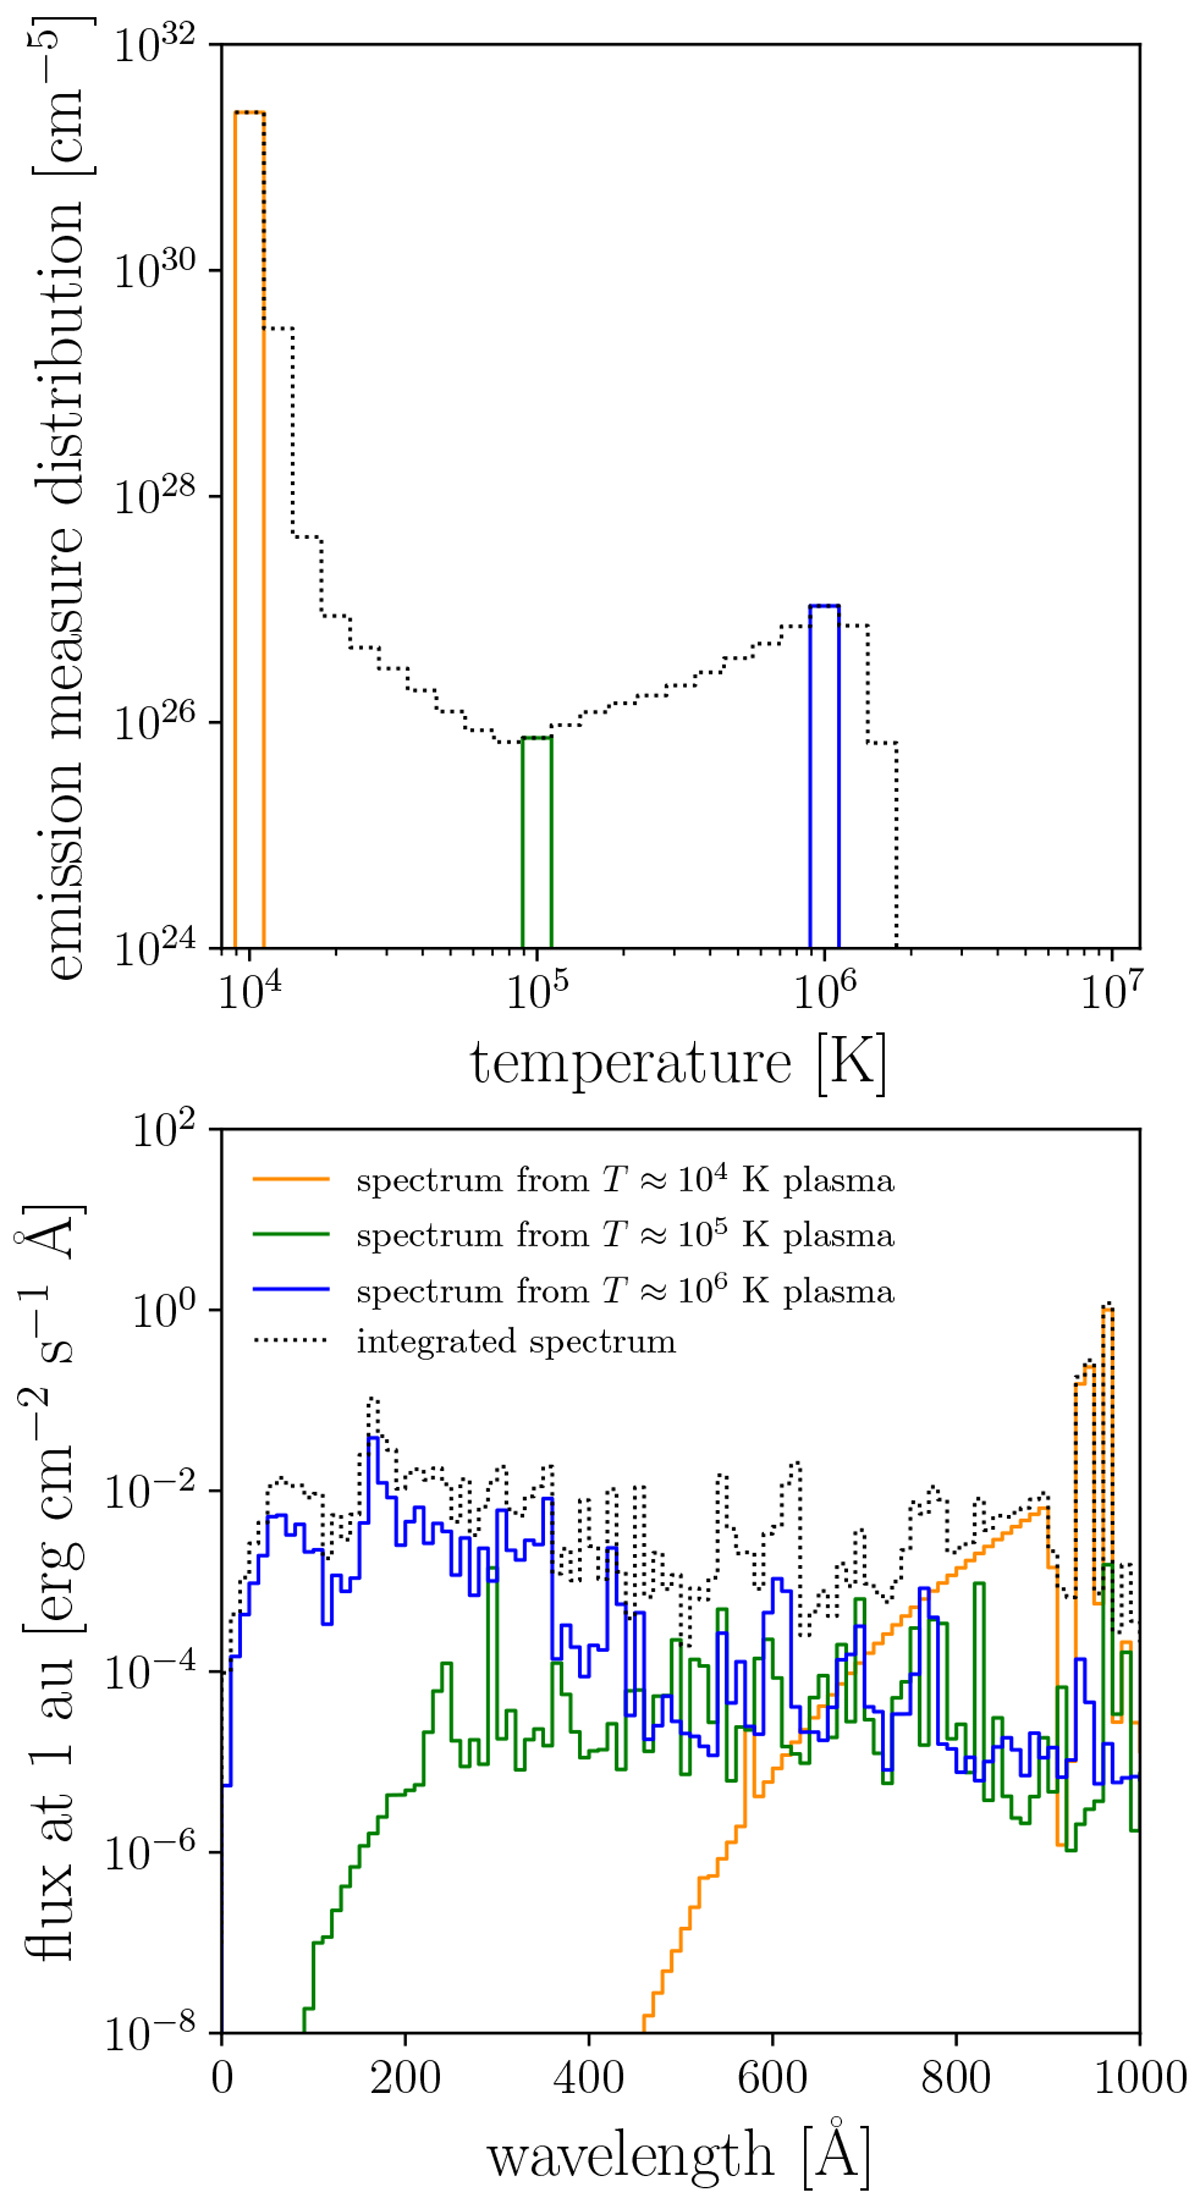
Fig. C.1
Download original image
Emission measure in the limited range of temperature and corresponding spectral energy flux at 1 au. For better visualisation, the spectral energy fluxes in the bottom panel are averaged over 10 Å. Orange, green and blue lines correspond to the emission measures and spectral energy fluxes of T ≈ 104 K (chromosphere), T ≈ 105 K (transition region) and T ≈ 106 K (corona), respectively. Black dotted lines show the full emission measure distribution and corresponding full spectral energy flux.
Current usage metrics show cumulative count of Article Views (full-text article views including HTML views, PDF and ePub downloads, according to the available data) and Abstracts Views on Vision4Press platform.
Data correspond to usage on the plateform after 2015. The current usage metrics is available 48-96 hours after online publication and is updated daily on week days.
Initial download of the metrics may take a while.