Fig. 11
Download original image
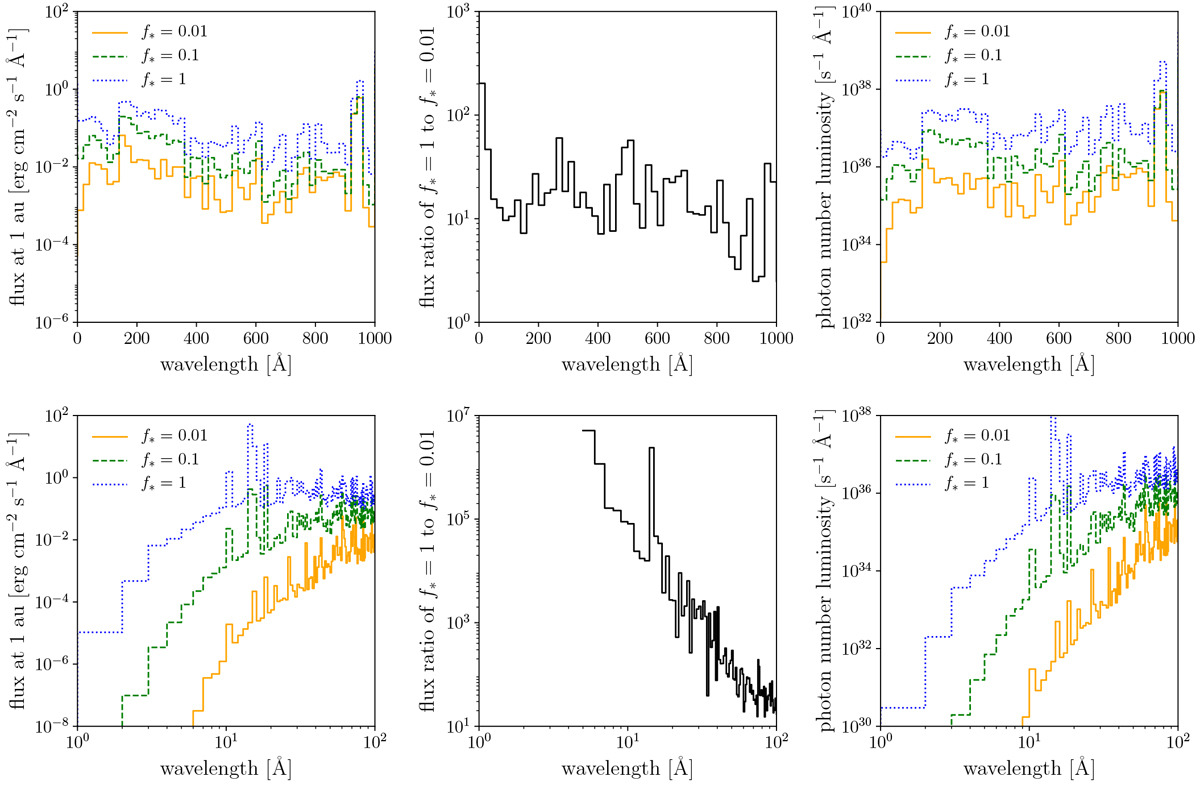
Filling-factor dependence of the XUV spectrum. Left: spectral energy flux at 1 au for f* = 0.01 (orange, solid), f* = 0.1 (green, dashed), and f* = 1 (blue, dotted). Centre: energy-flux ratio of f* = 1 to f* =0.01. Right: photon-number luminosity spectrum for f* = 0.01 (orange, solid), f* = 0.1 (green, dashed), and f* = 1 (blue, dotted). Bottom panels are the same as top panels but with logarithmic x axis thatemphasise the short-wavelength region. For better visualisation, spectra are averaged over 20 Å-bins in the top panels.
Current usage metrics show cumulative count of Article Views (full-text article views including HTML views, PDF and ePub downloads, according to the available data) and Abstracts Views on Vision4Press platform.
Data correspond to usage on the plateform after 2015. The current usage metrics is available 48-96 hours after online publication and is updated daily on week days.
Initial download of the metrics may take a while.