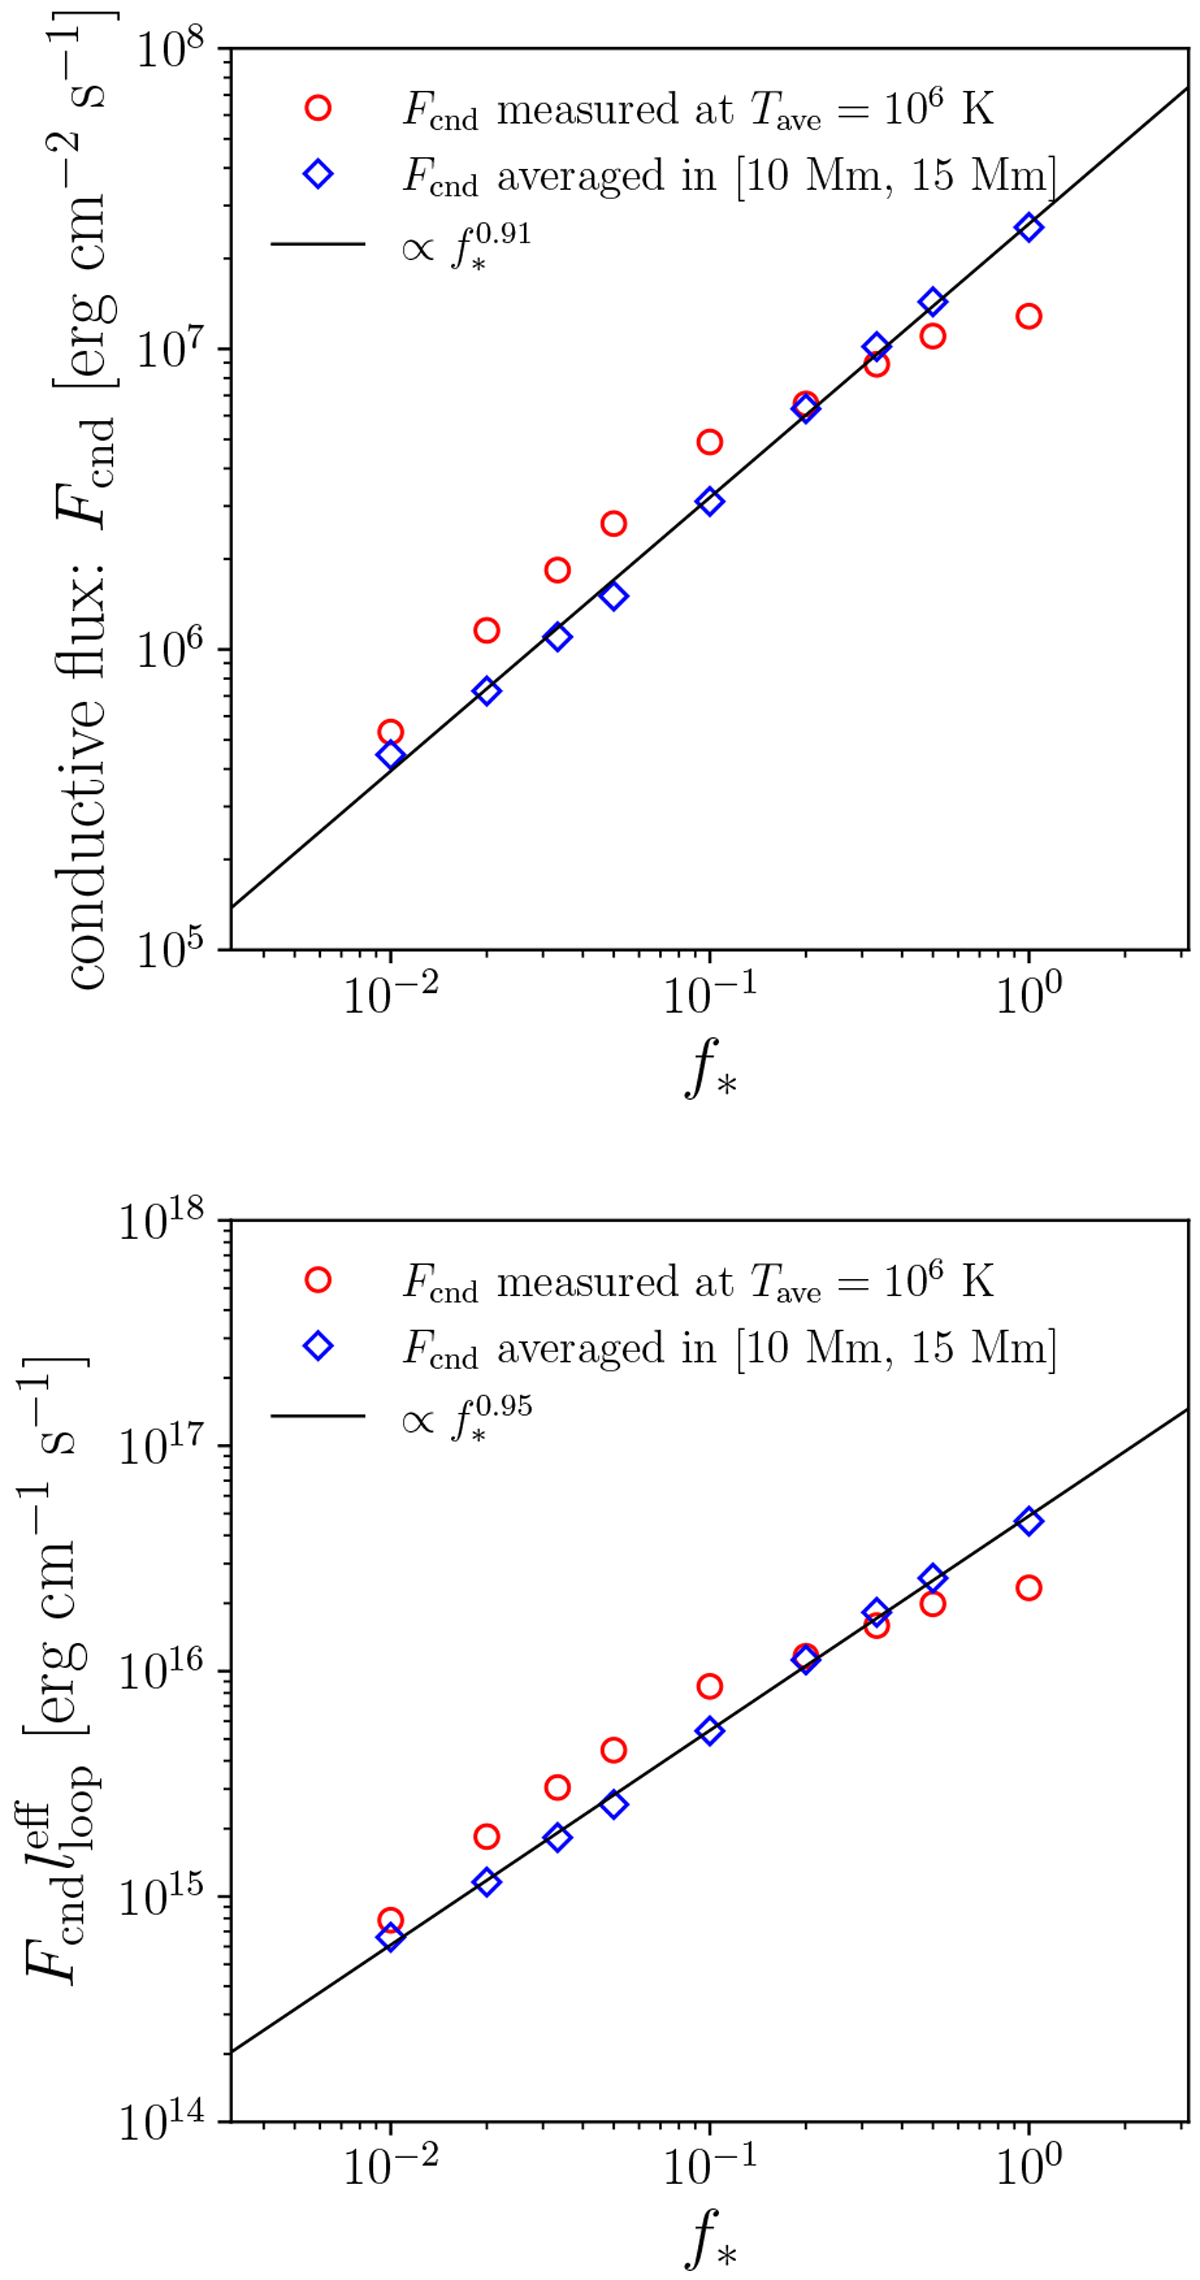
Fig. 10
Download original image
Relation between filling factor and coronal conductive flux. Top: magnetic filling factor on the photosphere f* versus backward conductive flux measured in the corona. The half loop length is fixed to lloop =20 Mm. The red circles and blue diamonds represent the flux measured at Tave = 106 K and averaged in 10 Mm ≤ s ≤ 15 Mm. The black solid line is the power-law fitting to the blue diamonds. Bottom: same as the top panel but the vertical axis denotes ![]() .
.
Current usage metrics show cumulative count of Article Views (full-text article views including HTML views, PDF and ePub downloads, according to the available data) and Abstracts Views on Vision4Press platform.
Data correspond to usage on the plateform after 2015. The current usage metrics is available 48-96 hours after online publication and is updated daily on week days.
Initial download of the metrics may take a while.