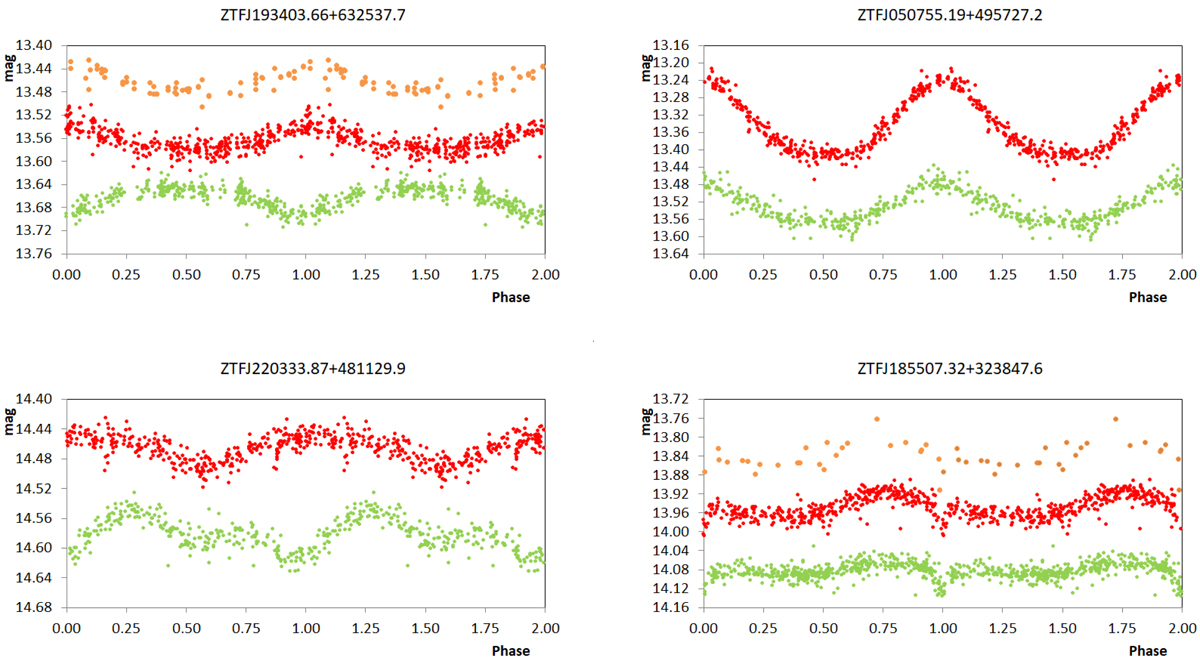
Fig. 7.
Download original image
Example light curves illustrating the four different subgroups among our sample stars: (i) g and r data are in anti-phase (upper left panel), (ii) the amplitude in r is larger than in g (upper right panel), (iii) the light curves in g and r are not consistent (lower left panel), and (iv) eclipses with possible additional ACV variability (lower right panel). Orange, red, and green symbols correspond to i, r, and g band data, respectively.
Current usage metrics show cumulative count of Article Views (full-text article views including HTML views, PDF and ePub downloads, according to the available data) and Abstracts Views on Vision4Press platform.
Data correspond to usage on the plateform after 2015. The current usage metrics is available 48-96 hours after online publication and is updated daily on week days.
Initial download of the metrics may take a while.