Fig. 8.
Download original image
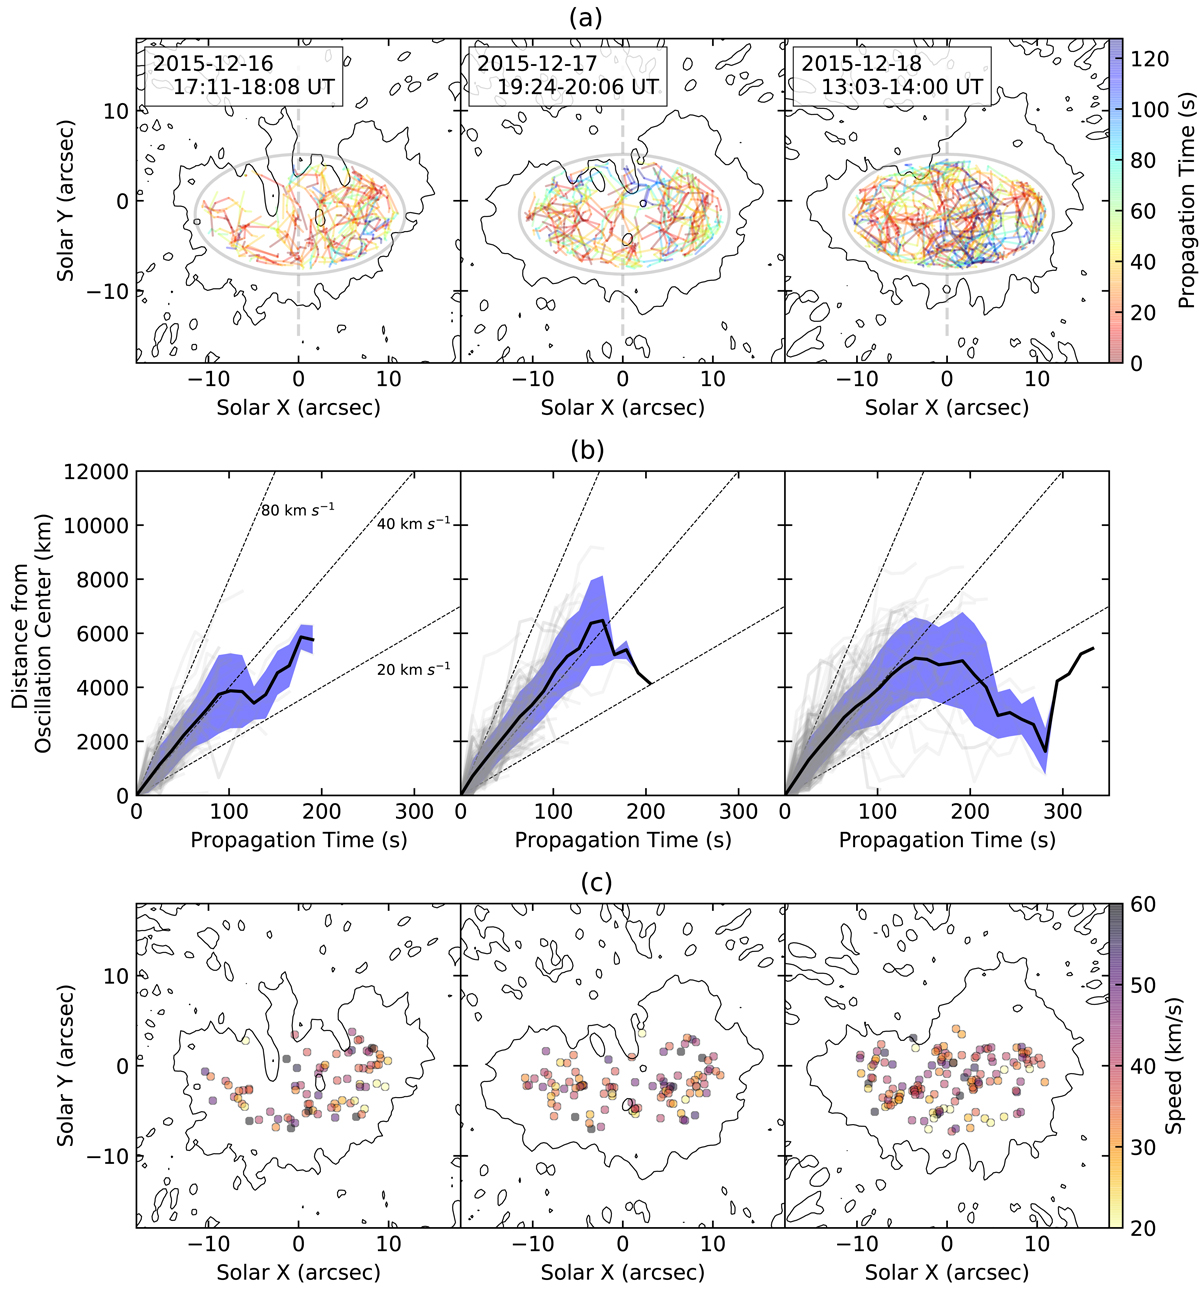
Analysis results of the motion of umbral flashes. a: trajectory of the identified umbral flashes. The solid line indicates the movement of the center of the umbral flashes for each event. The color indicates the propagation time from the beginning of each event. b: time-distance plot of umbral flash motion. Each gray solid line represents the propagation of an umbral flash from its oscillation center. The black solid line and blue area indicate the mean value of the distance and standard deviation of the distance. The guidelines at 20, 40, and 80 km s−1 are shown with dashed lines. c: positions of the oscillation centers with averaged receding speed. The color corresponds to the averaged radial propagation speed, which is equivalent to the mean gradient of each gray line in (b). The black contour indicates the umbral-penumbral boundary in the IRIS SJI 2832 Å. Each column represents a different observational date.
Current usage metrics show cumulative count of Article Views (full-text article views including HTML views, PDF and ePub downloads, according to the available data) and Abstracts Views on Vision4Press platform.
Data correspond to usage on the plateform after 2015. The current usage metrics is available 48-96 hours after online publication and is updated daily on week days.
Initial download of the metrics may take a while.