Fig. 7.
Download original image
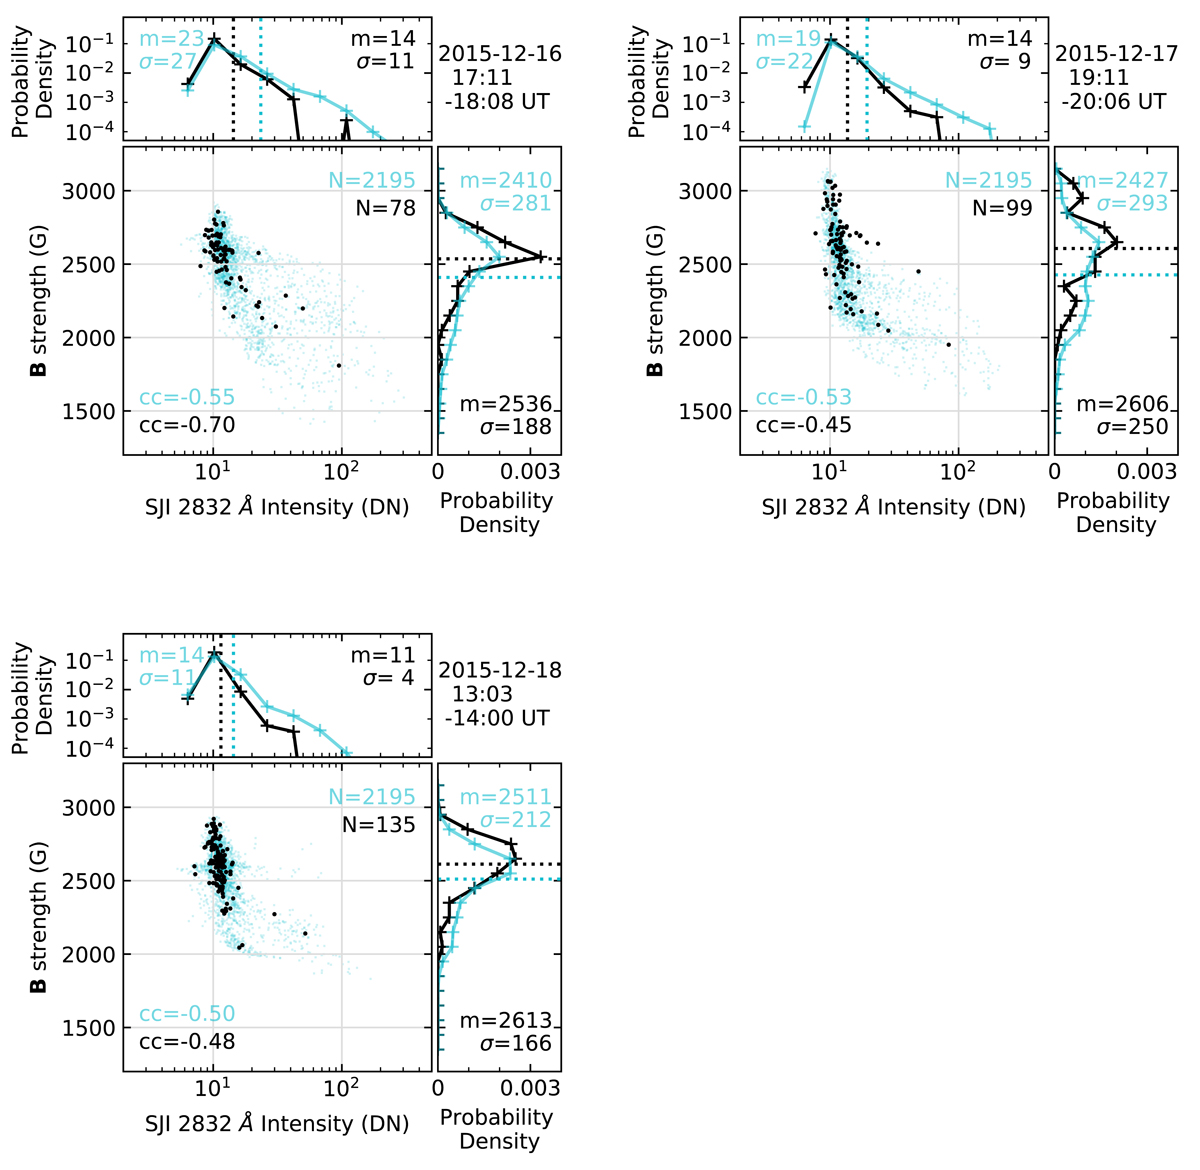
Scatter plots between the IRIS SJI 2832 Å intensity and the HMI magnetic field strength. The format is similar to Fig. 5. The IRIS SJI 2832 Å intensity and magnetic field strength histograms are shown above and to the right, respectively, of each scatter plot. The black and light blue plots indicate respectively the results from the oscillation centers and the whole umbra defined by the inside of the ellipse in Fig. 6a. The IRIS SJI 2832 Å intensity is plotted in a logarithmic scale.
Current usage metrics show cumulative count of Article Views (full-text article views including HTML views, PDF and ePub downloads, according to the available data) and Abstracts Views on Vision4Press platform.
Data correspond to usage on the plateform after 2015. The current usage metrics is available 48-96 hours after online publication and is updated daily on week days.
Initial download of the metrics may take a while.