Fig. 6.
Download original image
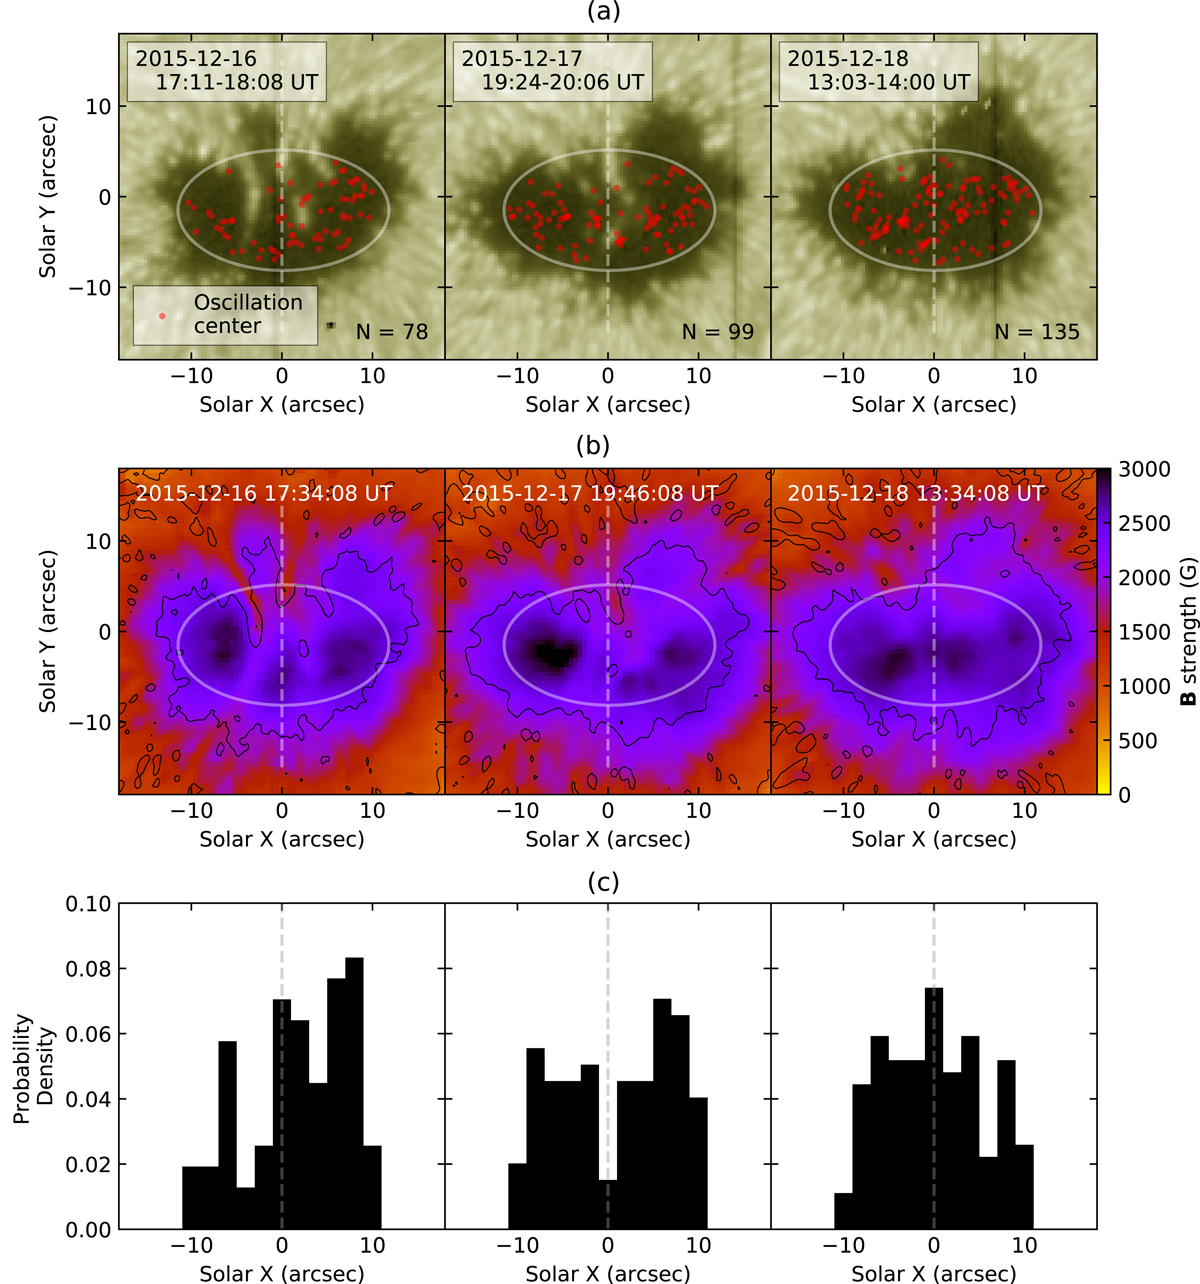
Analysis results of spatial distribution of the identified oscillation centers. a: positions of the oscillation centers (red dots). The background image is from the IRIS SJI 2832 Å data, which shows the solar atmosphere at the photospheric height. The white ellipse and dashed line indicate a defined umbral region for identifying the umbral flashes and the convergent interface, respectively. b: HMI magnetic field strength map. The black contour indicates the umbral-penumbral boundary obtained from the IRIS SJI 2832 Å image. c: distribution of the oscillation centers from the convergent interface. Each column represents a different observation date.
Current usage metrics show cumulative count of Article Views (full-text article views including HTML views, PDF and ePub downloads, according to the available data) and Abstracts Views on Vision4Press platform.
Data correspond to usage on the plateform after 2015. The current usage metrics is available 48-96 hours after online publication and is updated daily on week days.
Initial download of the metrics may take a while.