Fig. 5.
Download original image
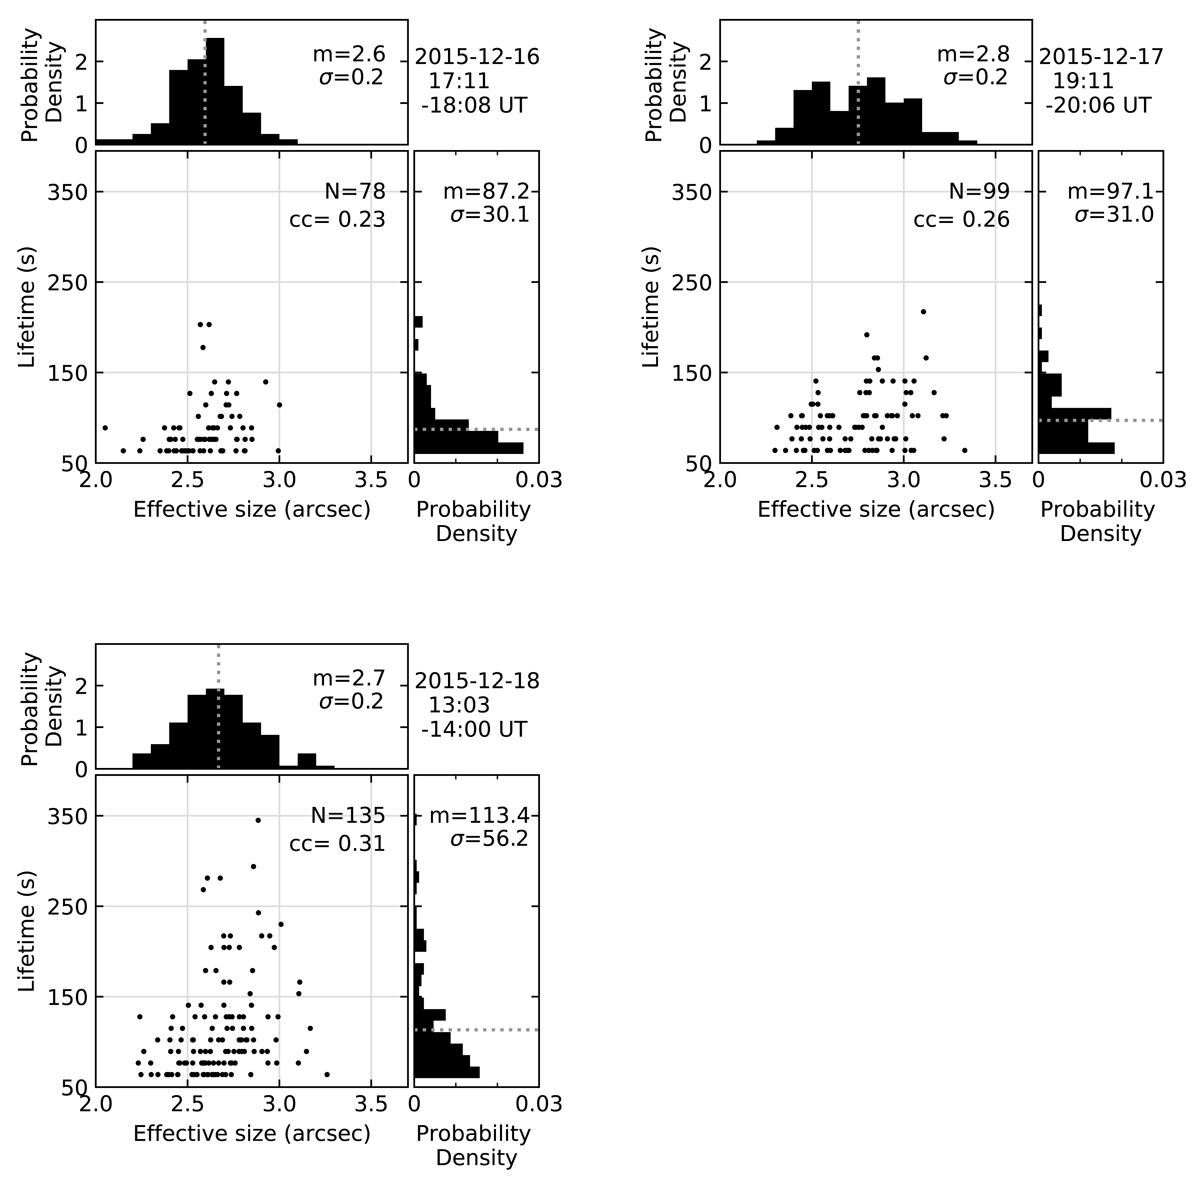
Scatter plots between the effective size and lifetime of identified brightening features from the three SJI 2796 Å data sets. The probability density histogram of effective size and lifetime are shown respectively at the top and to the right of the scatter plots. The date, time, total number of the identified umbral flash events N, mean value m, and standard deviation σ are indicated in each panel. The dotted gray line indicates the mean value of each parameter. The methodological lower limits of the effective size and lifetime are 2″ and 65 s, respectively.
Current usage metrics show cumulative count of Article Views (full-text article views including HTML views, PDF and ePub downloads, according to the available data) and Abstracts Views on Vision4Press platform.
Data correspond to usage on the plateform after 2015. The current usage metrics is available 48-96 hours after online publication and is updated daily on week days.
Initial download of the metrics may take a while.