Fig. 4.
Download original image
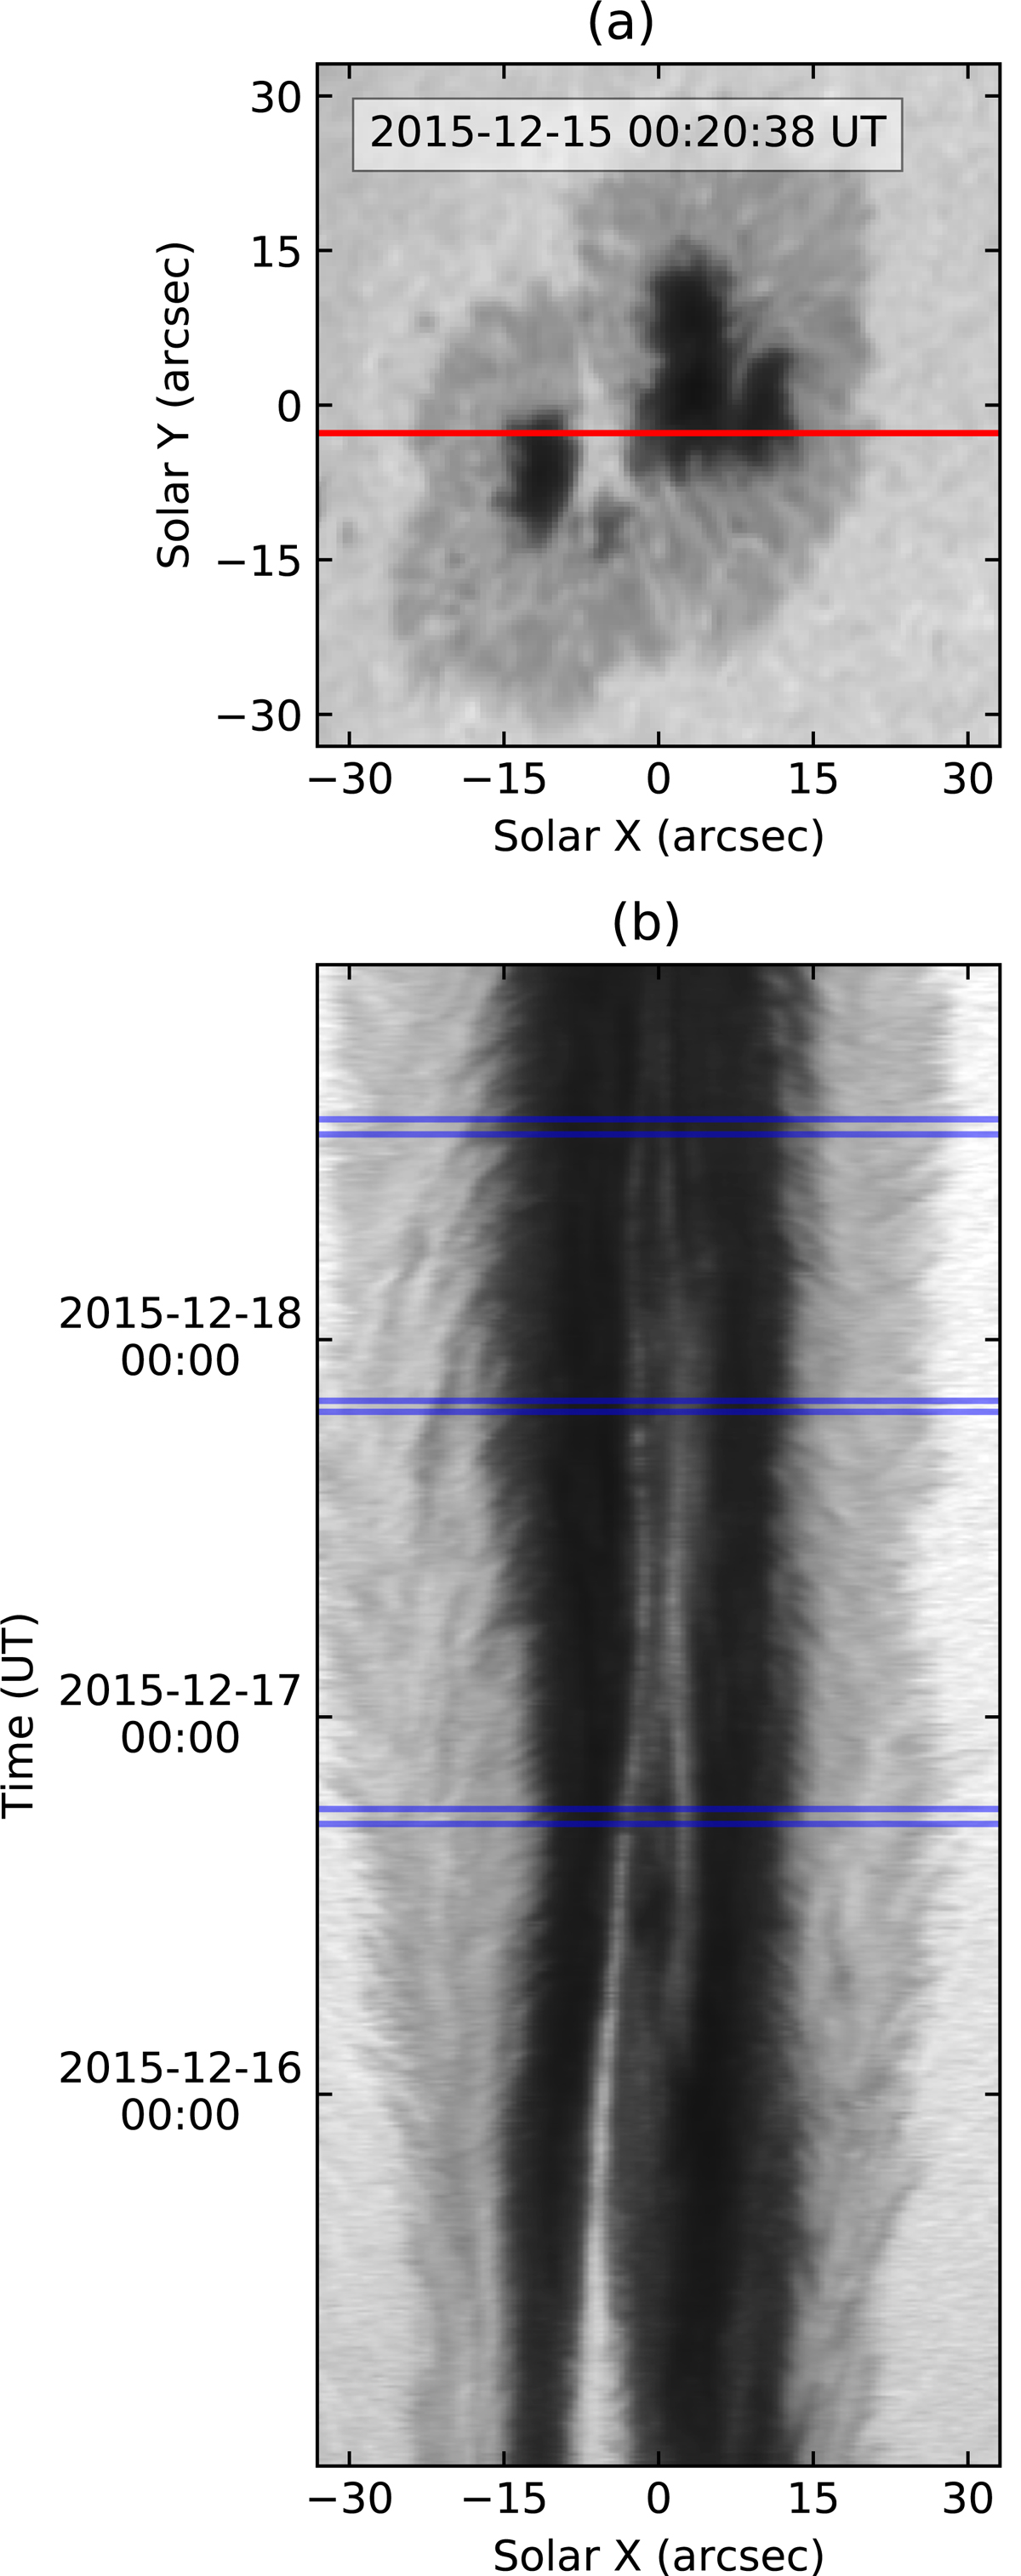
Sunspot evolution observed by SDO/HMI intensitygram. a: initial stage of the merging sunspot on Dec. 15, 2015. The red solid line indicates the slit position for the following time-distance map. b: time-distance map of intensity from Dec. 15 to 18, 2015. The three time domains (blue solid lines) indicate the time covered by IRIS SJI data sets.
Current usage metrics show cumulative count of Article Views (full-text article views including HTML views, PDF and ePub downloads, according to the available data) and Abstracts Views on Vision4Press platform.
Data correspond to usage on the plateform after 2015. The current usage metrics is available 48-96 hours after online publication and is updated daily on week days.
Initial download of the metrics may take a while.