Fig. 9.
Download original image
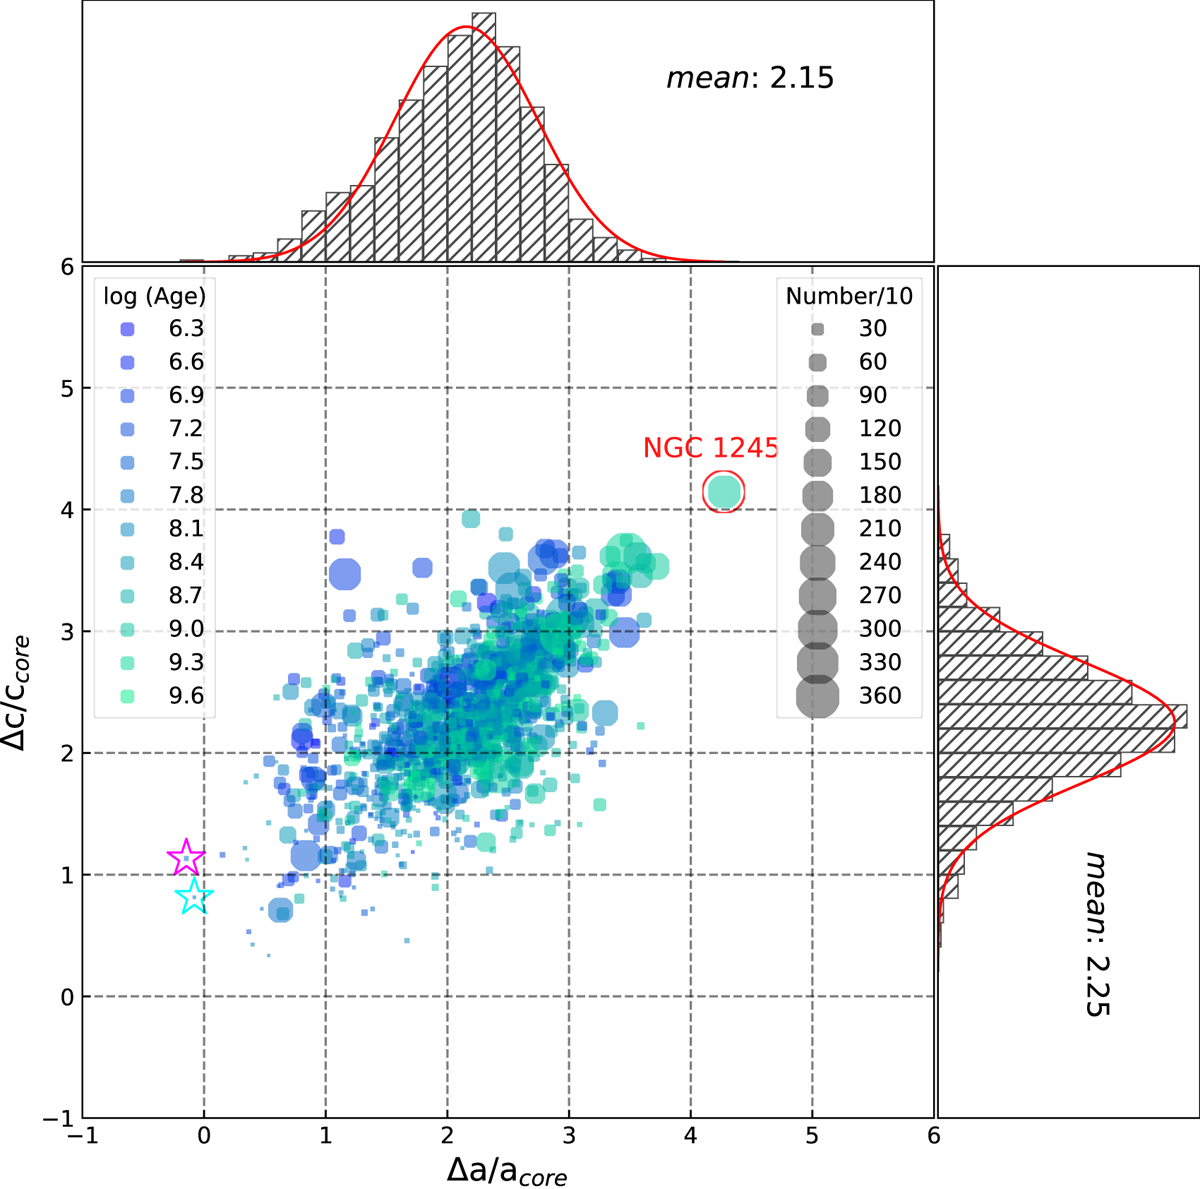
Δc/ccore distribution function for sample clusters with their Δa/acore distribution. The color shade of the solid circles indicates the logarithmic ages (years) of the sample clusters. The size of the symbol is proportional to the number of sample cluster members. The magenta pentagram represents the cluster UBC14, and the cluster UPK88 is marked in the cyan pentagram. The dashed lines in the picture are the grid lines for the radial stratification distribution of sample clusters. Histograms of Δc/ccore and Δa/acore of the sample clusters are displayed at the right side and top of the picture, respectively. The red curve lines over the histograms are Gaussian fitting lines.
Current usage metrics show cumulative count of Article Views (full-text article views including HTML views, PDF and ePub downloads, according to the available data) and Abstracts Views on Vision4Press platform.
Data correspond to usage on the plateform after 2015. The current usage metrics is available 48-96 hours after online publication and is updated daily on week days.
Initial download of the metrics may take a while.