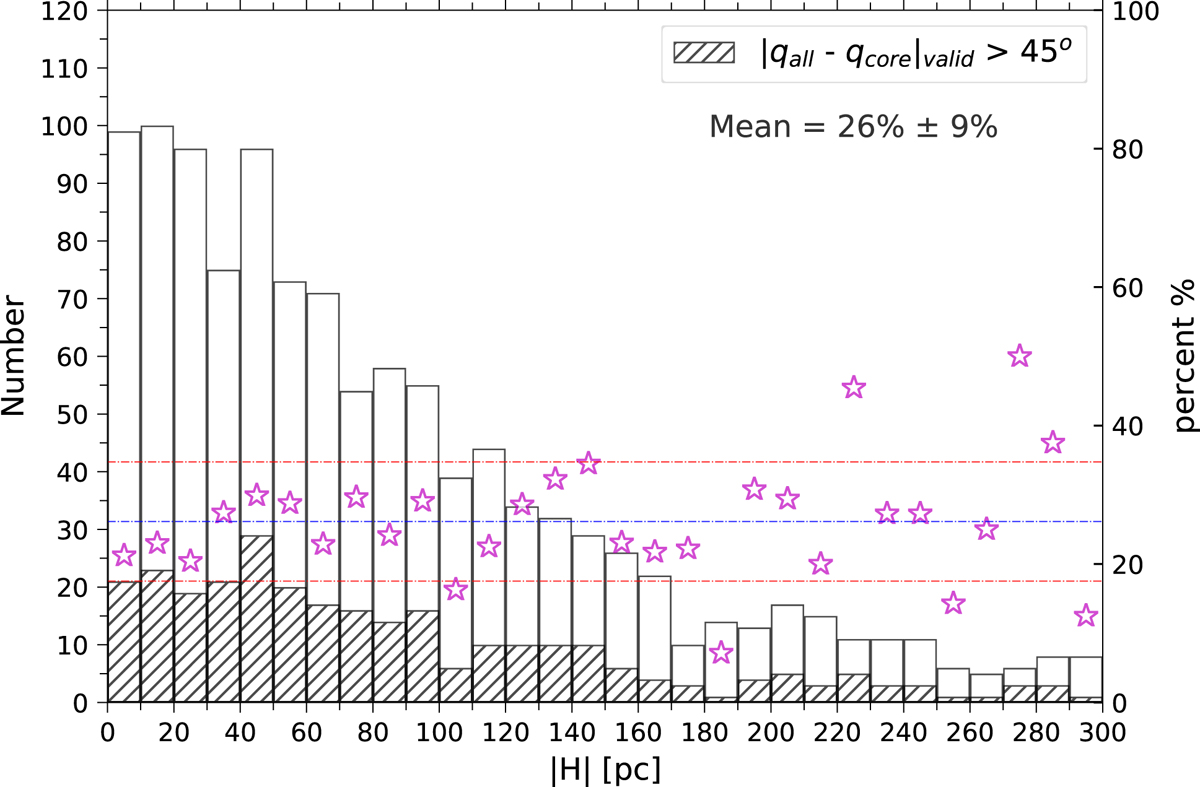
Fig. 11.
Download original image
Histogram of the sample clusters with |H| ≤ 300 pc and the distribution of the proportion of the sample clusters with the effective dip angle difference greater than 45° from each interval to the total clusters in each interval. The empty histogram represents the total clusters in each interval, while the shadow histogram the sample clusters with |qall − qcore|valid > 45° in each interval. The open purple pentagram in the panel represents the proportion of the sample clusters with the effective dip angle difference greater than 45° from each interval to the total clusters in each interval. The blue dashed line marks the mean of these proportions and the red dashed line represents its error.
Current usage metrics show cumulative count of Article Views (full-text article views including HTML views, PDF and ePub downloads, according to the available data) and Abstracts Views on Vision4Press platform.
Data correspond to usage on the plateform after 2015. The current usage metrics is available 48-96 hours after online publication and is updated daily on week days.
Initial download of the metrics may take a while.