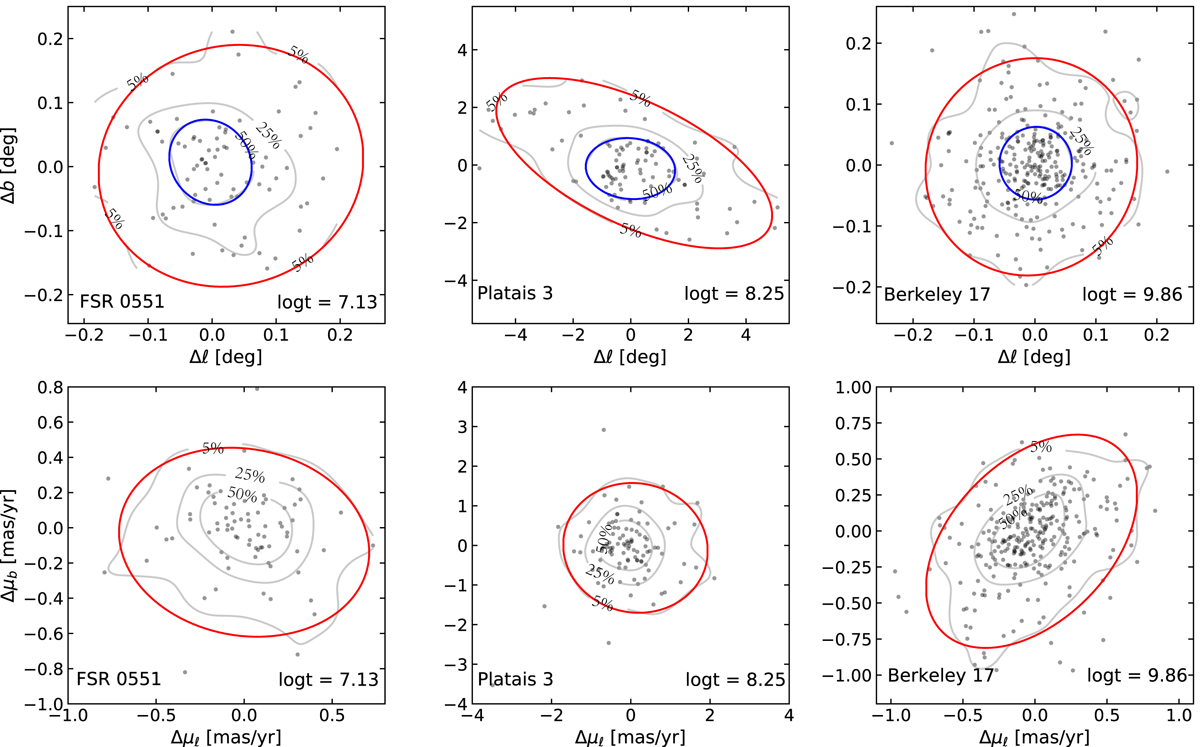
Fig. 1.
Download original image
General scheme of fitting cluster density profiles in the 2D spherical Galactic coordinate system, as well as that in the proper motion space, for three open clusters (FSR 0551, Platais 3, and Berkeley 17). For each cluster in the top three panels, the black dots represent the member stars of a cluster with the gray lines as the stellar number density profiles at 50% of and 5% of the peak. The fitted ellipses of 50% and 5% of the peak stellar number density of the clusters are marked in blue and red, respectively. The percentage labels on the gray lines represent the relative percentage of the actual density value relative to the peak. For each cluster in the bottom three panels, the black dots still represent the member stars of a cluster with the gray lines as the stellar number density profiles at 5% of the peak. The fitted ellipse of 5% of the peak stellar number density of the clusters is marked in red. The density contours at 5% in some panels are incomplete because a grid with specific boundaries was selected for the density evaluation.
Current usage metrics show cumulative count of Article Views (full-text article views including HTML views, PDF and ePub downloads, according to the available data) and Abstracts Views on Vision4Press platform.
Data correspond to usage on the plateform after 2015. The current usage metrics is available 48-96 hours after online publication and is updated daily on week days.
Initial download of the metrics may take a while.