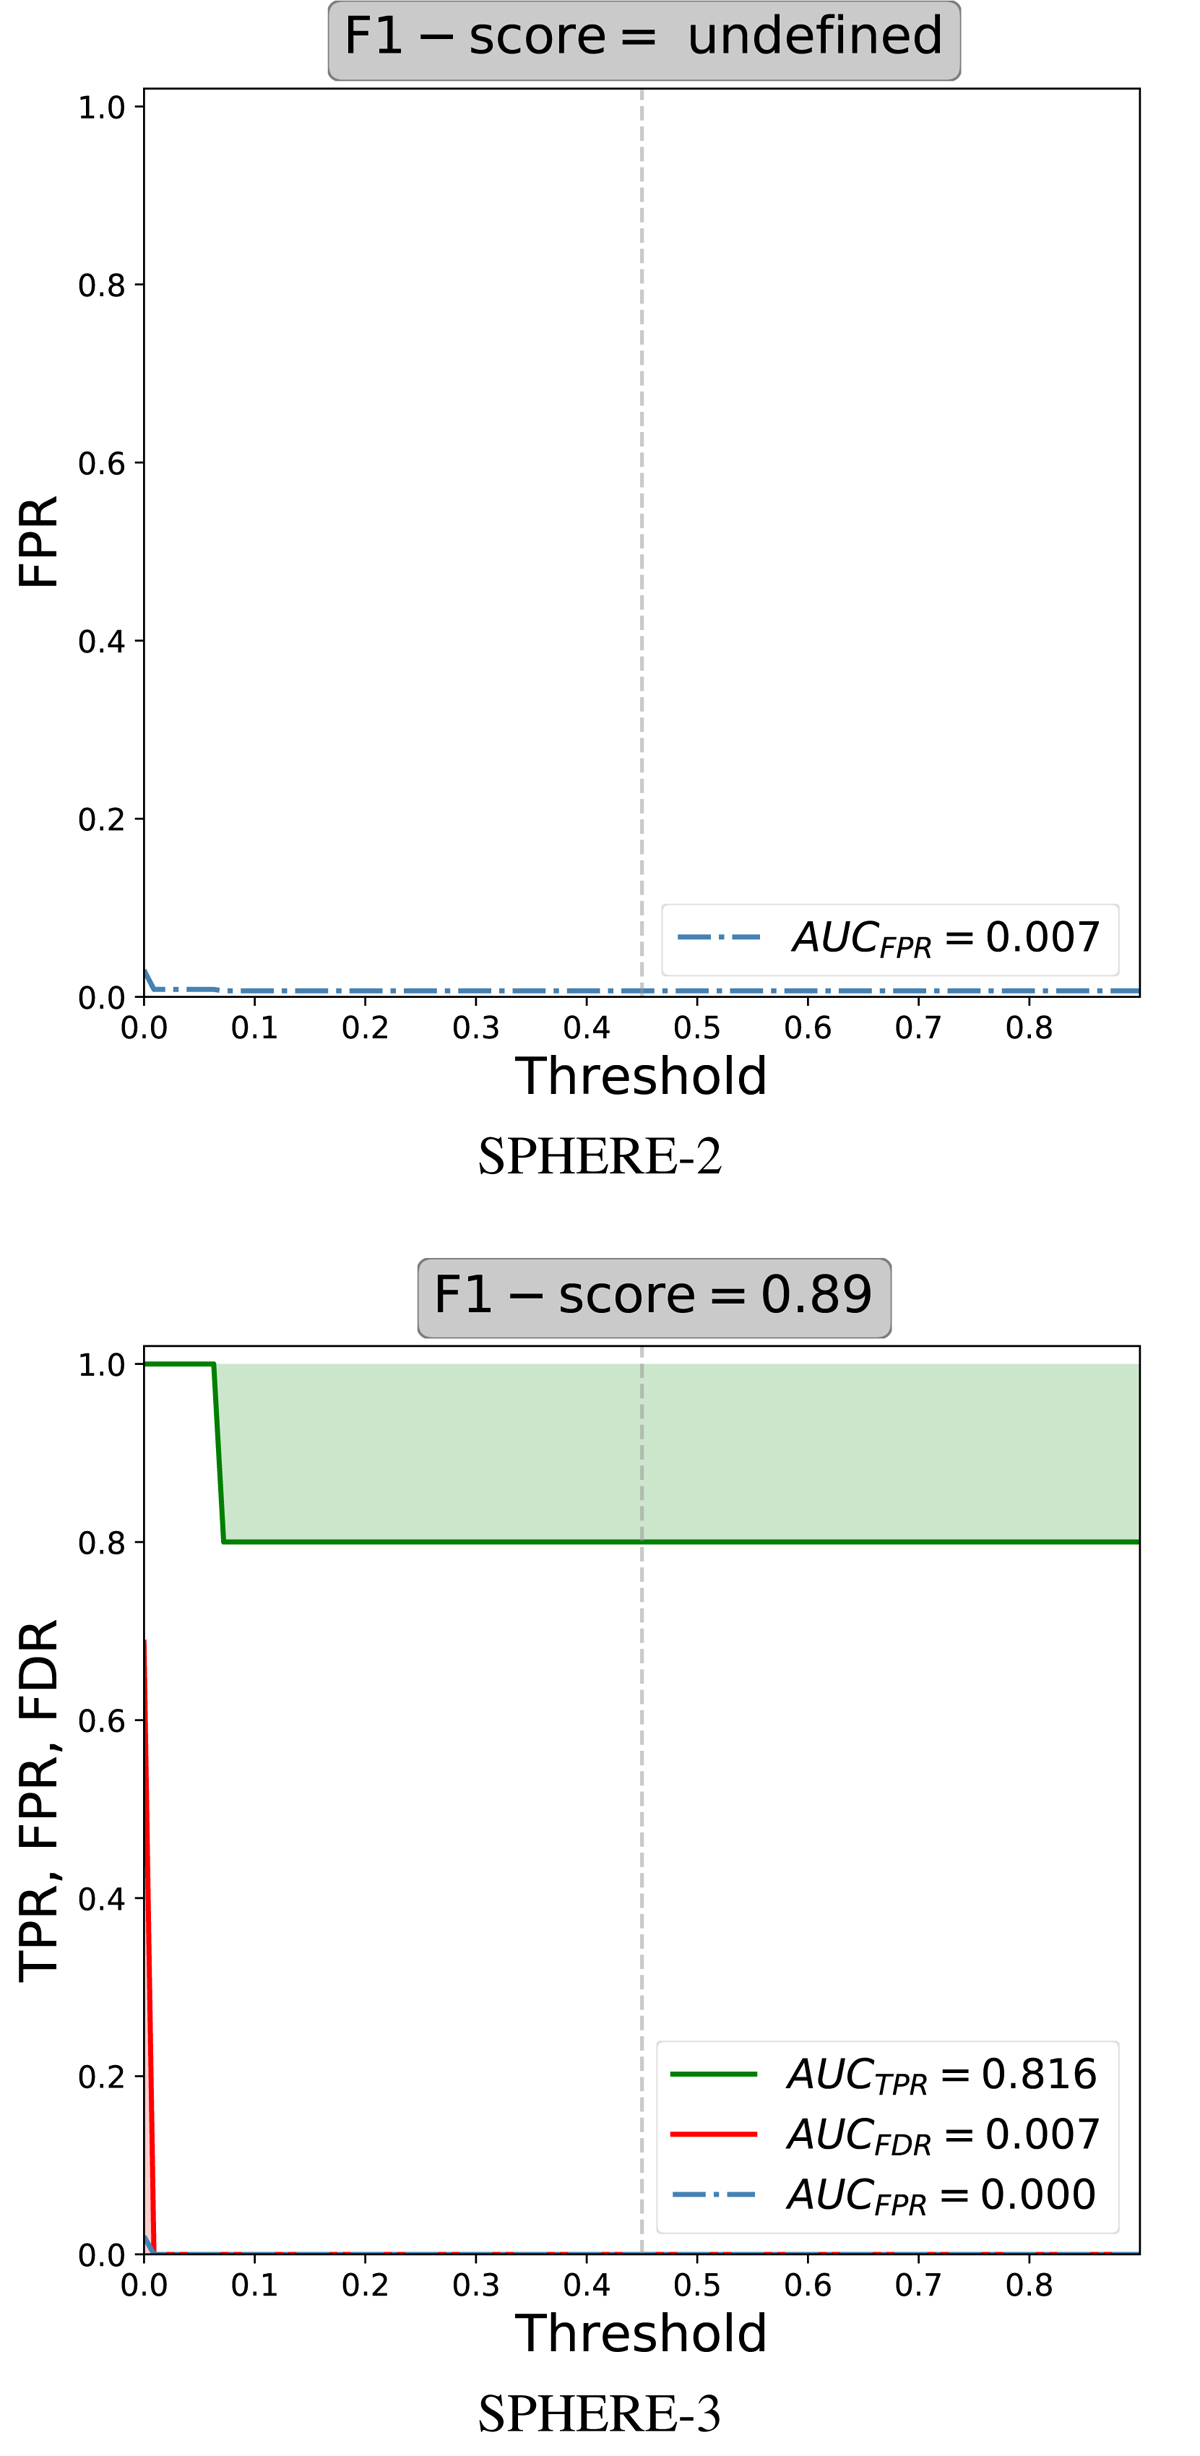
Fig. 9.
Download original image
True positive rate (green), False discovery rate (in red), and False positive rate (dash-dotted blue line) computed for a range of thresholds varying from zero to twice the selected 0.45 detection threshold (represented by a dotted vertical line). These curves are computed for the SPHERE-2 and SPHERE-3 data sets of the EIDC, relying on the detection maps estimated with the SPHERE-1 optimal set of parameters along with the full-frame version of auto-RSM using the bottom-up approach.
Current usage metrics show cumulative count of Article Views (full-text article views including HTML views, PDF and ePub downloads, according to the available data) and Abstracts Views on Vision4Press platform.
Data correspond to usage on the plateform after 2015. The current usage metrics is available 48-96 hours after online publication and is updated daily on week days.
Initial download of the metrics may take a while.