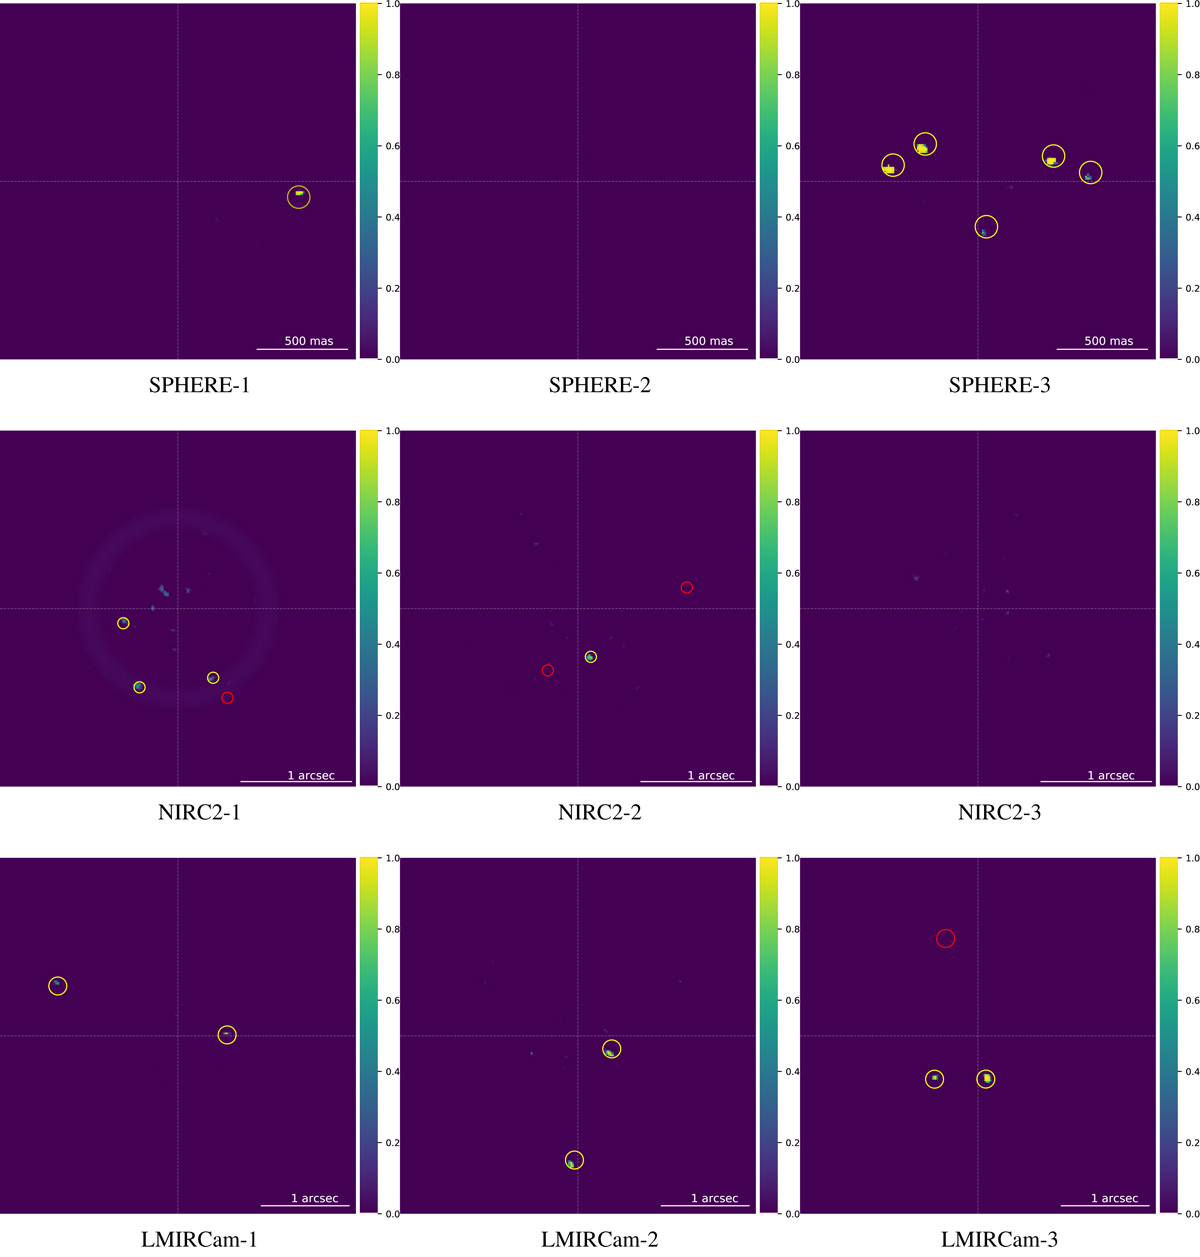
Fig. 4.
Download original image
Detection maps corresponding to the nine data sets of the EIDC, generated with the full-frame version of auto-RSM using the bottom-up approach for the selection of the optimal set of cubes of likelihoods, as well as the forward approach for the computation of the probabilities. The yellow circles are centred on the true position of the detected targets (TP) and the red circles give the true positions of FNs.
Current usage metrics show cumulative count of Article Views (full-text article views including HTML views, PDF and ePub downloads, according to the available data) and Abstracts Views on Vision4Press platform.
Data correspond to usage on the plateform after 2015. The current usage metrics is available 48-96 hours after online publication and is updated daily on week days.
Initial download of the metrics may take a while.