Fig. 2.
Download original image
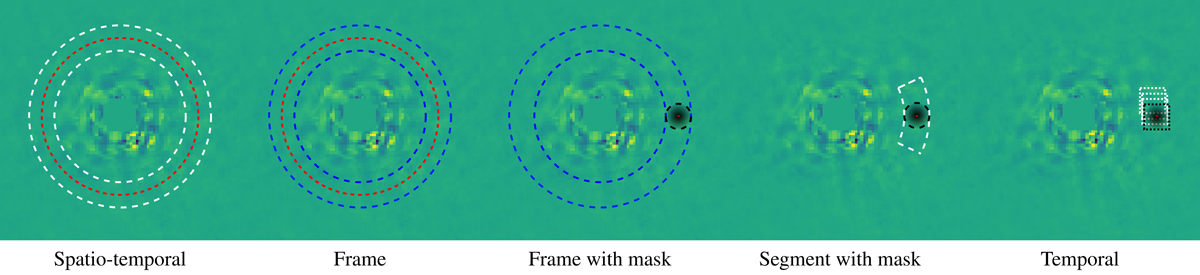
Graphical representation of the estimation of residual noise properties using the five proposed approaches. The red circle/point indicates the pixel for which the likelihood is estimated. White and blue circles encompass the set of pixels used for computation of the noise properties. White circles indicate that the entire set of frames from the derotated cube are used for the computation, while blue circles indicate that the estimation is done frame-wise. Black circles define a mask, i.e. pixels that are not considered in the estimation.
Current usage metrics show cumulative count of Article Views (full-text article views including HTML views, PDF and ePub downloads, according to the available data) and Abstracts Views on Vision4Press platform.
Data correspond to usage on the plateform after 2015. The current usage metrics is available 48-96 hours after online publication and is updated daily on week days.
Initial download of the metrics may take a while.