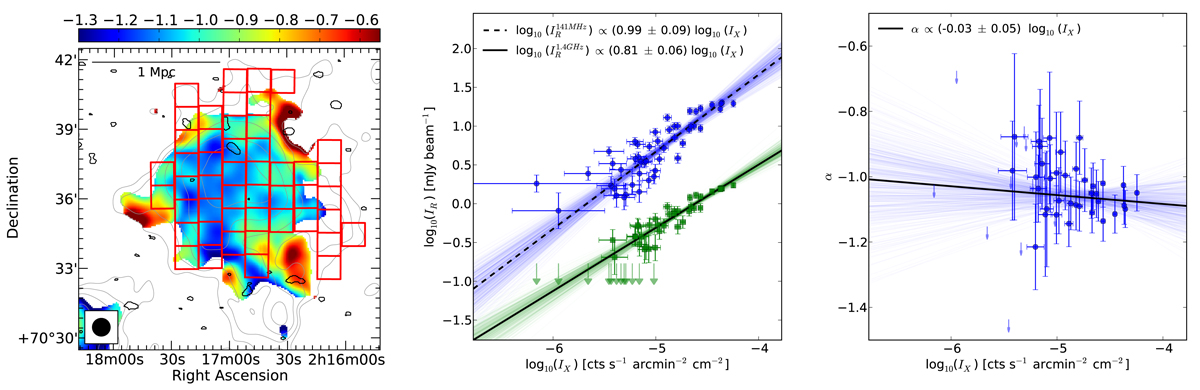
Fig. 9.
Download original image
Left: regions where radio and X-ray data are extracted. Middle: correlation between radio and X-ray SB. Right: scatter plot of the radio spectral index and X-ray SB. The solid and dashed (black) lines show the best-fit results from the MCMC runs. The thin (blue and green) lines are the fitting results of some individual MCMC runs. In both plots, the 2σ upper limits are shown with the downward- and leftward-pointing arrows.
Current usage metrics show cumulative count of Article Views (full-text article views including HTML views, PDF and ePub downloads, according to the available data) and Abstracts Views on Vision4Press platform.
Data correspond to usage on the plateform after 2015. The current usage metrics is available 48-96 hours after online publication and is updated daily on week days.
Initial download of the metrics may take a while.