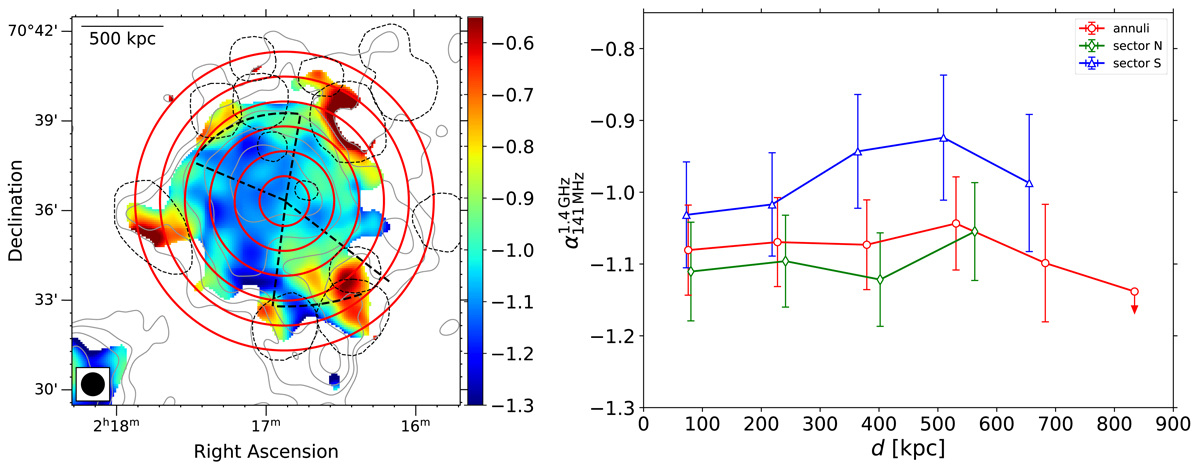
Fig. 7.
Download original image
Left: 141 MHz–1.4 GHz spectral index map in the halo region. The discrete sources were removed from the data before the spectral index map was made. The red annuli and black dashed sectors are where the spectral indices are estimated, and they are shown in the right panel. The outermost regions of the N and S sectors are where X-ray SB discontinuities are found in Zhang et al. (2020). The thin dashed lines are the regions where discrete sources are subtracted or show locally flat spectra, which are excluded from the profiles. The LOFAR grey contours are ±[1, 2, 4, 8, 16] × 3σ, where σ = 345 μJy beam−1 (beamFWHM = 46″). Right: spectral index profiles from the halo centre towards the outskirts and towards the N and S sectors.
Current usage metrics show cumulative count of Article Views (full-text article views including HTML views, PDF and ePub downloads, according to the available data) and Abstracts Views on Vision4Press platform.
Data correspond to usage on the plateform after 2015. The current usage metrics is available 48-96 hours after online publication and is updated daily on week days.
Initial download of the metrics may take a while.