Fig. 6.
Download original image
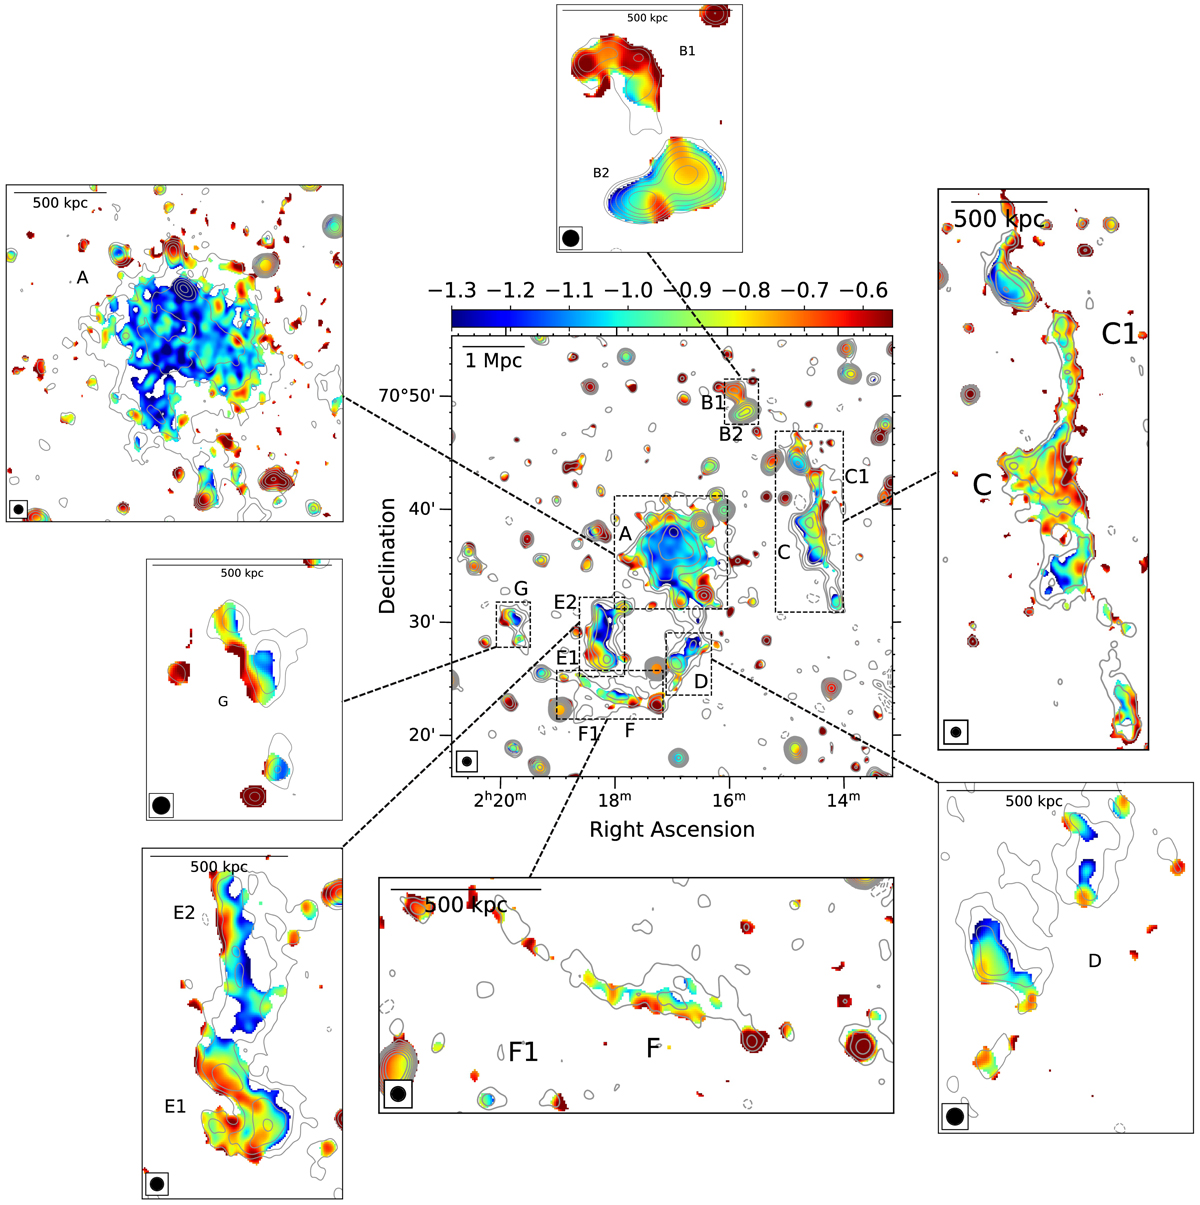
Spectral index map (central) between 141 MHz and 1.4 GHz at the resolution of 46″. The cutout images show the distribution of spectral indices between 141 MHz and 1.5 GHz at 16″ resolution. The LOFAR contour levels are ±[1, 2, 4, 8, 16] × 3σ, where σ = 345 μJy beam−1 (beamFWHM = 46″) and σ = 190 μJy beam−1 (beamFWHM = 16″) for the central and the cutout images, respectively. The corresponding maps for the spectral index errors are presented in Appendix C.
Current usage metrics show cumulative count of Article Views (full-text article views including HTML views, PDF and ePub downloads, according to the available data) and Abstracts Views on Vision4Press platform.
Data correspond to usage on the plateform after 2015. The current usage metrics is available 48-96 hours after online publication and is updated daily on week days.
Initial download of the metrics may take a while.