Fig. 2.
Download original image
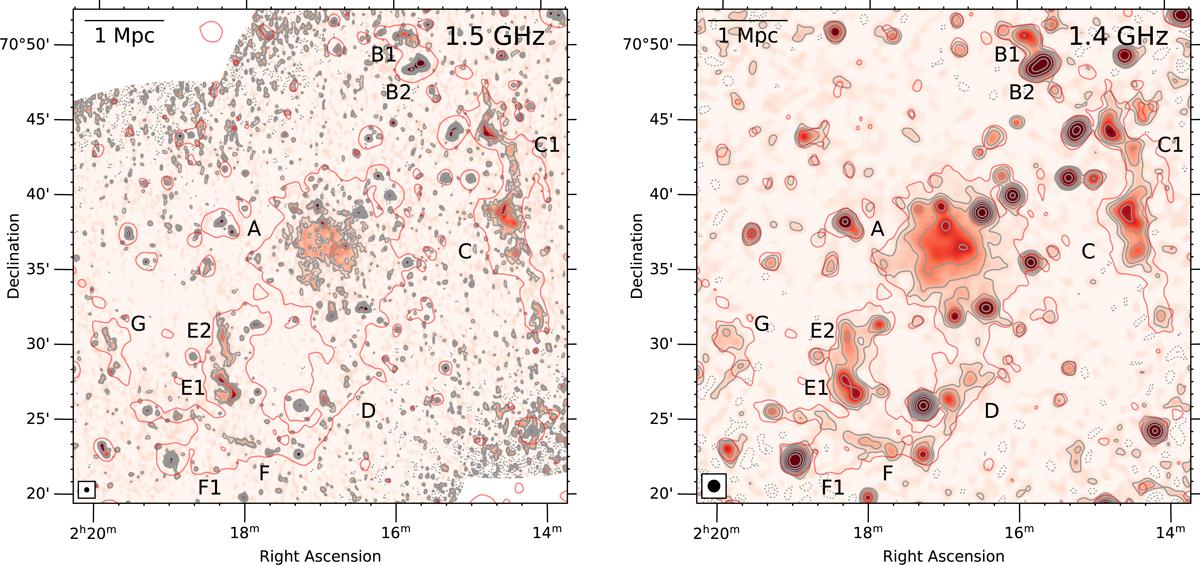
VLA C- (left) and D-array (right) images. The contour starts from 3σ, where σC−array = 40 μJy beam−1 and σD−array = 85 μJy beam−1. The subsequent contours are multiplied by a factor of two. The synthesised beams are drawn in the bottom-left corners (i.e. 16″ × 16″ for the C-array image and 46″ × 46″ for the D-array image). The LOFAR 45.7″ × 44.7″ resolution contour is the same as that in Fig. 1.
Current usage metrics show cumulative count of Article Views (full-text article views including HTML views, PDF and ePub downloads, according to the available data) and Abstracts Views on Vision4Press platform.
Data correspond to usage on the plateform after 2015. The current usage metrics is available 48-96 hours after online publication and is updated daily on week days.
Initial download of the metrics may take a while.