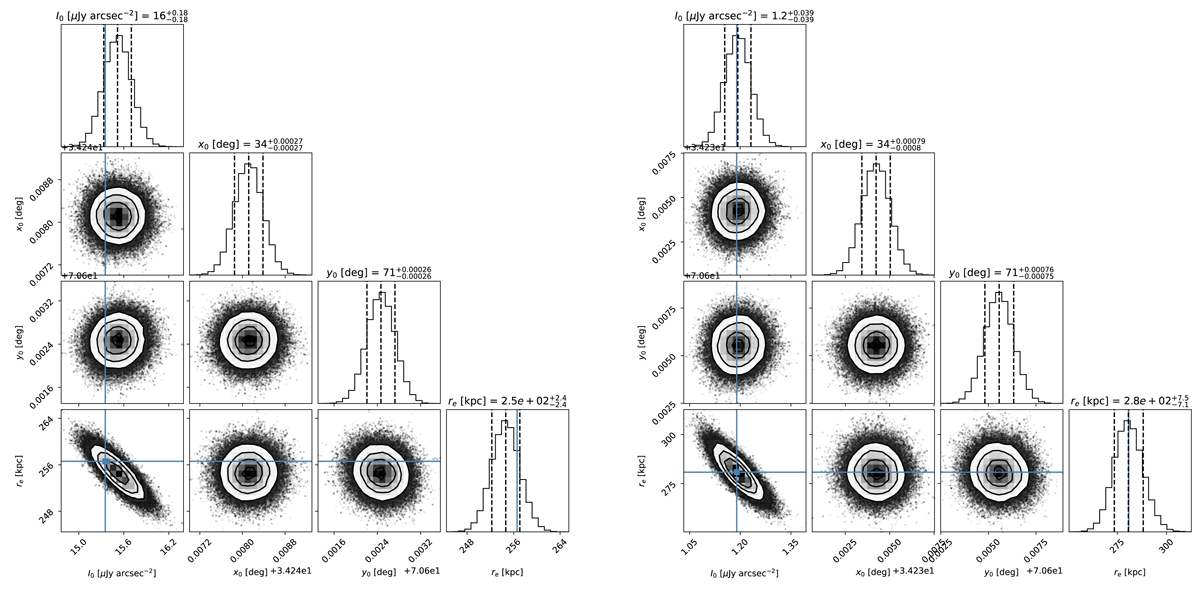
Fig. B.1.
Download original image
Corner plots obtained from the fitting of a two-dimensional circular model to the SB of the radio halo at 141 MHz (left) and 1.4 GHz (right). The blue lines show the initial estimates for the peak brightness, I0, and the e-folding radius, re, by the pre-MCMC fitting. The x0 and y0 are the best-fit values in R.A. and Dec. of the halo peak.
Current usage metrics show cumulative count of Article Views (full-text article views including HTML views, PDF and ePub downloads, according to the available data) and Abstracts Views on Vision4Press platform.
Data correspond to usage on the plateform after 2015. The current usage metrics is available 48-96 hours after online publication and is updated daily on week days.
Initial download of the metrics may take a while.