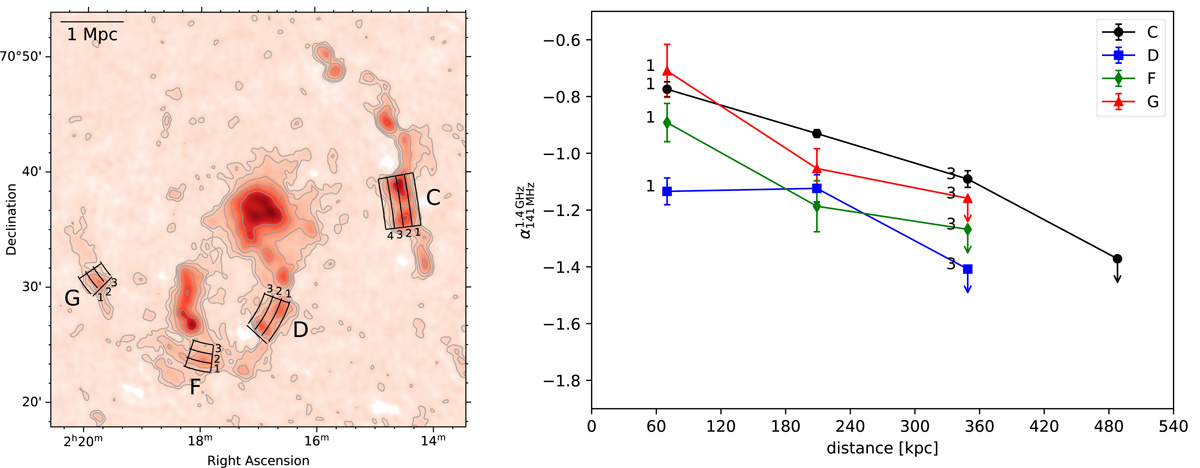
Fig. 10.
Download original image
Left: regions across the relics where spectral indices are extracted. The width of the regions is 46″, which is equal to the size of the synthesised beam. Right: spectral index profiles across the width of the relics in the left panel. The downward-pointing arrows indicate the upper limit of the spectral indices. The error bars show the 1σ uncertainties that are estimated from the image noise. The upper limits for the spectral indices (i.e. the arrows) are calculated using the upper limits of 2σ for the 1.4 GHz emission.
Current usage metrics show cumulative count of Article Views (full-text article views including HTML views, PDF and ePub downloads, according to the available data) and Abstracts Views on Vision4Press platform.
Data correspond to usage on the plateform after 2015. The current usage metrics is available 48-96 hours after online publication and is updated daily on week days.
Initial download of the metrics may take a while.