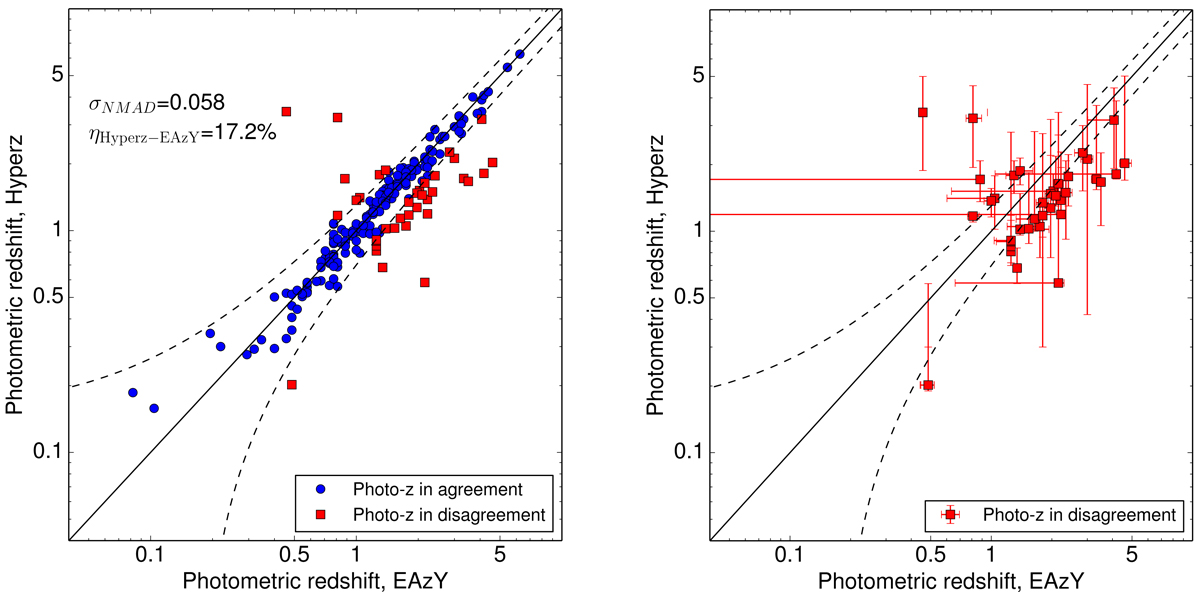
Fig. 9.
Download original image
Left: photometric redshifts computed with Hyperz as a function of those computed with EAzY. The black solid line marks the zEAzY = zHyperz relation, while the dashed lines contain the zEAzY = zHyperz ± 0.15(1 + zHyperz) region. Sources where Δz/(1 + zHyperz) < 0.15 are plotted as blue circles, while sources where Δz/(1 + zHyperz) > 0.15 are plotted as red squares. Right: same as left, but with only the sources where Δz/(1 + zHyperz > 0.15) and their 68% uncertainties.
Current usage metrics show cumulative count of Article Views (full-text article views including HTML views, PDF and ePub downloads, according to the available data) and Abstracts Views on Vision4Press platform.
Data correspond to usage on the plateform after 2015. The current usage metrics is available 48-96 hours after online publication and is updated daily on week days.
Initial download of the metrics may take a while.